Managed Funds in Australia: Investors’ Guide to Structure, Selection & Portfolio Role
A managed fund is a pooled investment vehicle, almost always structured in Australia as a unit trust operated by a licensed responsible entity, in which investors own units representing a proportional claim on the fund’s net assets. Investors buy exposure to a professionally managed portfolio, a defined mandate and an operational infrastructure they could not economically replicate alone. In exchange, they accept manager risk, fee drag, limited control and, in many cases, liquidity terms that are far less generous than the daily pricing on the fund’s factsheet implies.
For most investors, the main decision is rarely ‘should I invest in a managed fund?’ It’s a sequence of harder questions such as: which structure, which liquidity profile, which fee architecture, which tax outcome, and what specific job the allocation performs that the rest of the portfolio can’t.
Table of Contents
Why The Managed Fund Decision Matters More In 2026 Than It Did In 2021
Three structural shifts have changed this decision for most investors.
Firstly, the risk-free rate is high and rising rather than falling.
The Reserve Bank held the cash rate at 4.35% at its August 2026 meeting, following three increases earlier in the year, with the next decision scheduled for 29 September. Headline inflation eased to 3.5% over the year to July, while the trimmed mean the Board watches most closely held at 3.6%, both above the RBA’s 2-3% target band.
Market economists are divided about the rate outlook. NAB has forecast a further 25 basis point rise in September, ANZ and CBA point to November, while Westpac expects the Board to remain unchanged for the remainder of the year.
The investment implication is widely underestimated. When cash yields close to nothing, a fund charging 90 basis points to deliver a modest return is competing against an alternative that returns almost nothing. When cash and term deposits pay over four per cent, that same fund is competing against a credible, capital-stable alternative, and the fee is being levied against a much smaller pool of excess return. Every basis point of cost is a larger fraction of the alpha the manager is attempting to generate.
Hence, fee scrutiny has intensified across the market at the same time as the rate cycle turned, and why comparing a fund’s return against its benchmark without also comparing it against the current term deposit rate is an incomplete analysis.
The second shift is structural.
Australian investors have been offered access to private markets at a pace and scale that would have been unimaginable a decade ago. Private credit in particular has moved from an institutional niche to a mainstream product category with retail-accessible minimums.
The regulator had noticed this evolution. ASIC’s REP 820, published in November 2025, reported its surveillance of 28 private credit funds spanning listed, unlisted, retail and wholesale vehicles, conducted between October 2024 and August 2025. Its findings were pointed: inconsistent reporting that obscured portfolio risk, opaque interest margin and fee structures, weak governance and poorly managed conflicts of interest. Fewer than half the funds reviewed had detailed written policies for managing loan defaults. ASIC has since confirmed poor private credit practices as a 2026 enforcement priority, has run a voluntary industry survey covering 52 funds managing $76 billion in assets, and has publicly put the sector on notice ahead of 30 June valuations.
This means that the dispersion between a well-run private credit fund and a poorly run one is far wider than the dispersion between two large-cap Australian equity funds, and investors bear the cost of failing to tell them apart.
The third change is fiscal.
The Federal Government’s Division 296 commenced on 1 July 2026 after passing Parliament in March. In its final form it applies an additional 15% to earnings attributable to the portion of an individual’s total superannuation balance above $3 million, and an additional 25% above $10 million, producing headline rates of 30% and 40% respectively. The final design abandoned the proposed taxation of unrealised gains and applies instead to realised earnings, with both thresholds indexed. Treasury has estimated 80,000 Australians were affected by the changes in the first year.
For fund investors, the significance is that realised earnings now carry a marginal cost for a specific and identifiable cohort of large-balance super investors.
A high-turnover managed fund that distributes substantial realised capital gains each year is a different proposition, inside a $4 million member balance, from a low-turnover fund that defers realisation. Portfolio turnover has moved from a second-order efficiency question to a first-order tax question for that cohort. It’s noteworthy that few product disclosure statements make turnover easy to find.
Australia’s Managed Fund Landscape: What the Data Shows & Where It Stops
Australia has one of the largest pools of professionally managed capital in the world relative to its population, driven by the country’s compulsory superannuation, but the official statistics on the managed fund industry specifically are less complete than most investors assume, because the Australian Bureau of Statistics paused its flagship publication in 2023.
The last ABS Managed Funds series reported a total managed funds industry of $4.75 trillion in funds under management for the December 2023 quarter.
Where the data is current, it is striking.
The ATO’s SMSF quarterly statistical report for March 2026 recorded 672,805 self-managed super funds with 1,239,977 members and total estimated assets of $1.06 trillion. Listed shares account for 26% of estimated SMSF assets and cash and term deposits around 16%. Net transfers from industry funds into SMSFs reached a rolling annual figure of $7.76 billion in the year to March 2026, against $0.88 billion in the year to March 2022.
In other words, the direction of travel is towards self-direction, which is the cohort that must make managed fund selection decisions without an institutional research team behind them.
The ETF industry has grown faster still.
Betashares reported the Australian exchange traded fund industry closed the June 2026 financial year at a record $372 billion in funds under management, with net flows of $30 billion in the half alone, matching the entirety of calendar 2024.
The industry reported $53 billion of inflows during calendar 2025, 76% above the prior year, and ended 2025 with 453 products from 65 issuers trading on the ASX and Cboe.
Betashares has forecast the industry passing $400 billion during 2026 and $500 billion by 2028 or possibly 2027.
That growth is often presented as a straightforward substitution of ETFs for unlisted managed funds.
The reality is more nuanced.
A large and rising share of ASX-quoted ETFs are being actively managed, sometimes as a quoted class of an existing unlisted trust. That reveals that a large portion of investors still want actively managed products that offer the potential for outperformance.
Moreover, the ‘active’ label on the wrapper increasingly tells you more about the access mechanism than the investment approach. So, investors comparing ETFs with managed funds as though these are two investment philosophies are really comparing two settlement systems.
What A Managed Fund Is: The Structure Beneath the Factsheet
In Australia, a managed fund is almost always a registered managed investment scheme constituted as a unit trust.
A responsible entity holding an Australian Financial Services Licence operates the scheme, owes statutory duties to members, and is bound by the fund’s constitution and compliance plan.
Investors hold units.
The unit price is derived from the net asset value of the fund divided by units on issue, adjusted by a buy or sell spread that allocates transaction costs to the transacting investor rather than the continuing ones.
Four features of that structure carry practical consequences that factsheets rarely spell out:
1. The responsible entity is the legal operator, and it is not always the investment manager.
Many funds are operated by a specialist responsible entity that has delegated portfolio management to a boutique operator. This is orthodox and often improves governance, since the operator has independent obligations. It also means the entity you are contracting with and the entity whose investment skill you are buying may be different, with separate financial strength, separate conflicts and separate incentives.
Read the constitution, not just the strategy page.
2. Unit pricing is a valuation exercise, not a market price.
For a fund holding ASX-listed securities, valuation is close to mechanical.
For a fund holding construction loans, unlisted property, or private company equity, the unit price is an estimate produced under a valuation policy, using inputs the manager selects, at a frequency the manager sets. ASIC’s private credit work found a lack of standardisation in valuation and provisioning practices across the Australian market. When you redeem from such a fund you are transacting at someone’s opinion of value. That’s an inherent property of the asset class and should change how much weight you place on a smooth reported return series.
3. The buy/sell spread is a real cost that never appears in the fee table.
A fund with a 0.25% buy and 0.25% sell spread imposes a half-percent round trip on an investor who enters and exits within a year.
For a core holding held for a decade, that’s immaterial.
For an investor who rebalances quarterly, or who is testing a manager with a small initial allocation, it is not.
4. Distributions are attributed, not simply paid.
Most Australian retail funds now operate under the Attribution Managed Investment Trust regime, which allows the responsible entity to attribute components of taxable income to members on a fair and reasonable basis, rather than relying on present entitlement to distributable income.
The AMMA statement arrives after year end. Investors need it in order to complete their return correctly, including the cost base adjustments that flow from the difference between cash distributed and taxable amounts attributed. The Australian Taxation Office’s guidance on AMITs is the authoritative source.
Retail Versus Wholesale: The Threshold That Changes Everything
A wholesale fund is offered only to investors who satisfy the wholesale client tests in the Corporations Act, most commonly by holding net assets of at least $2.5 million or gross income of at least $250,000 in each of the last two years, certified by an accountant, or by investing at least $500,000. Wholesale funds are not required to issue a product disclosure statement, are not subject to the same design and distribution obligations, and frequently carry minimums of $50,000 to $250,000.
There are trade-offs on both sides.
Wholesale structures can access strategies and fee arrangements that would be impractical to deliver through a retail PDS, and they avoid a compliance overhead that is ultimately paid for by unitholders.
Equally, the retail disclosure regime exists because disclosure is costly to produce and valuable to receive. An investor who qualifies as wholesale by virtue of asset size but has no professional investment background is receiving less protection because the law assumes sophistication that may not be present.
This distinction is worth using as a filter early rather than late.
The wholesale-only listings section makes the boundary explicit, which saves the frustration of researching a strategy in depth only to discover it is inaccessible.
The Structure Question: Four Ways to Buy the Same Exposure
The same underlying portfolio can be accessed through an unlisted unit trust, an exchange quoted fund, a listed investment company or trust, or a managed account.
These differ in how you transact, what price you receive, how tax flows through, and what happens when everyone wants out at once, as shown below:
Dimension
Unlisted Managed Fund
Exchange Quoted Fund (ETF / Active ETF)
LIC / LIT
Managed Account (SMA/MDA)
Legal form
Unit trust (MIS)
Unit trust, quoted class
Company or trust with fixed capital
Beneficial ownership of underlying securities
Transacting
Application and redemption with the RE
Trade on ASX or Cboe via broker
Trade on ASX via broker
Model applied to your own holdings
Price received
NAV plus/minus spread
Market price, arbitraged toward iNAV by market makers
Market price, may trade at premium or discount to NTA
Not applicable, you hold the assets
Capital stability
Open ended, flows change fund size
Open ended via creation/redemption
Closed ended, capital is fixed
Individual
Structural risk in stress
Redemption pressure, possible gating
Spread widening, liquidity of underlying
Discount widening
Model dispersion, cash drag
Tax
AMIT attribution, embedded gains socialised
AMIT attribution, redemption mechanism can reduce embedded gains
Company tax, franked dividends, or trust attribution
Individual cost base per security
Typical minimum
$5,000 to $250,000
One unit
One share
$25,000 to $500,000
Suits
Strategies with capacity constraints, illiquid assets
Liquid, scalable exposures
Illiquid strategies needing permanent capital
Investors wanting tax control and transparency
The closed-ended point deserves emphasis because it is the most misunderstood item on the table.
A listed investment trust holding illiquid credit assets, such as Perpetual Credit Income Trust, doesn’t face redemption pressure, because there is no redemption mechanism. If you want out, you sell to another investor on market.
That structural permanence is what allows the manager to hold assets that can’t be sold fast, and it is an advantage for the ETF strategy.
The cost is transferred to you as price risk: in a period of stress, the discount to net tangible assets can widen when you most want to exit.
Similarly, Ophir High Conviction Fund uses the listed structure to run a concentrated small and mid-cap Australian portfolio without forced selling into small-cap illiquidity, and Cordish Dixon Private Equity Fund III applies the same logic to a private equity portfolio with a multi-year realisation cycle.
The structure is adding value in each case.
An investor who dismisses LICs and LITs because they trade at discounts has confused a symptom with a design feature, and an investor who buys them without a view on the discount has ignored half the return equation.
The LIC and LIT listings are a good place to observe how varied the category has become.
Conversely, an open-ended unlisted fund holding illiquid assets has the mismatch that the closed-ended vehicle avoids. It offers redemption terms that assume most investors won’t use them simultaneously. The risk is that assumption holds until it doesn’t.
Active or Index: What the Evidence Says
Over one-year periods, active manager results in Australia vary widely by asset class and are strongly influenced by the shape of the benchmark’s return.
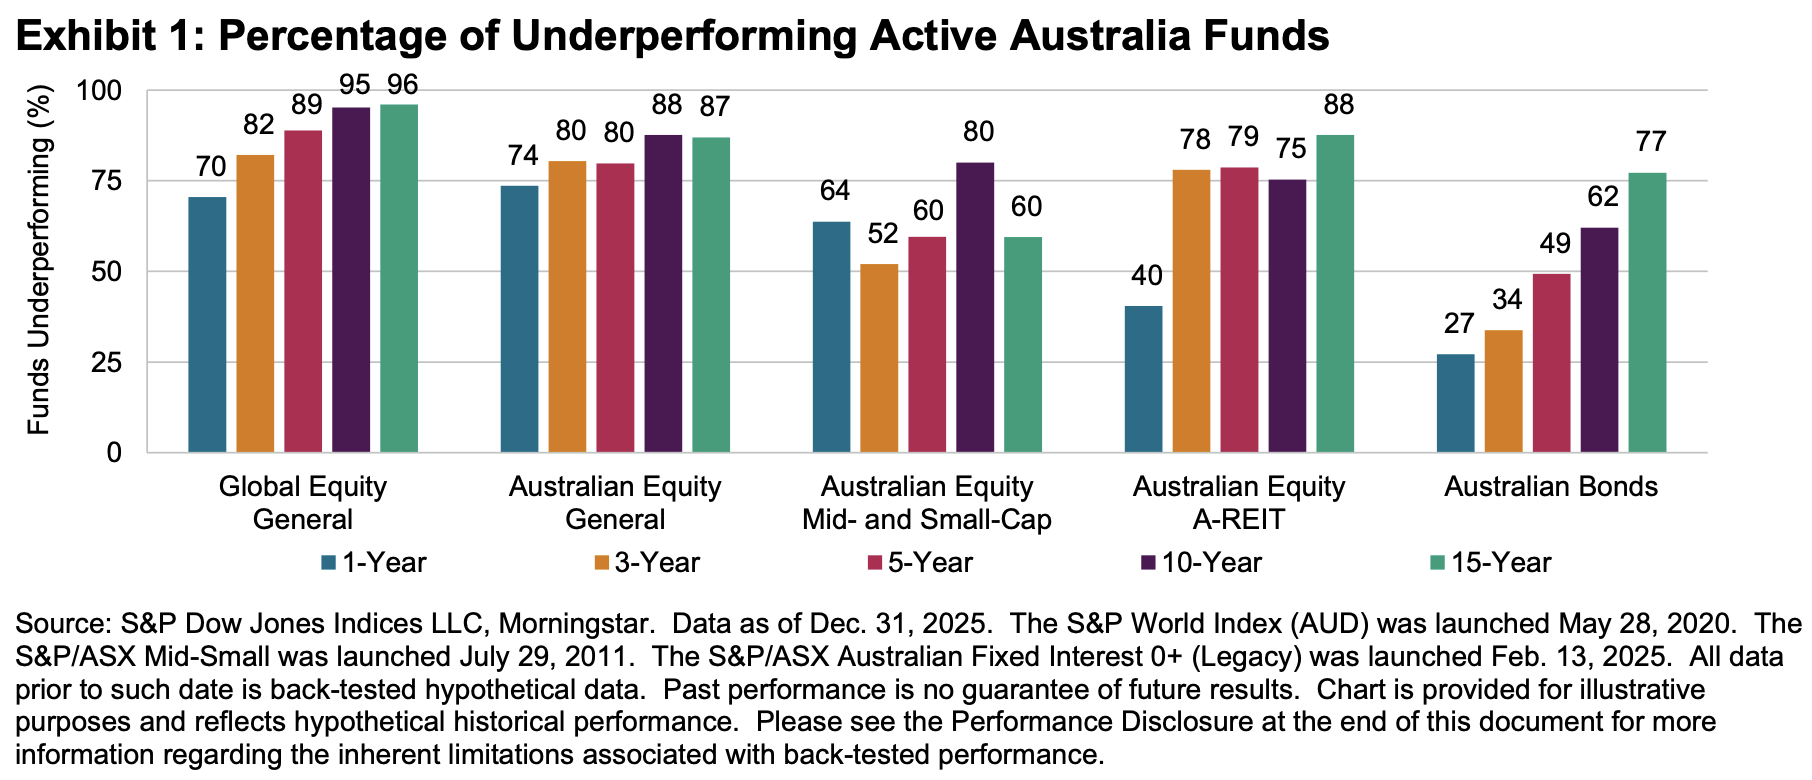
Over ten- and fifteen-year periods, the majority of funds in every category has underperformed.
The most rigorous Australian evidence is the SPIVA Australia Scorecard, produced by S&P Dow Jones Indices, which measures active funds against assigned benchmarks and, importantly, corrects for survivorship by including funds that were merged or liquidated during the period.
The conclusion is that the base rate of success by active manager is low, it differs materially by asset class, and identifying the exception in advance is a skill that most investors don’t possess and can’t access cheaply.
There are six important implications:
Asset class makes a significant difference. Active Australian bond funds recorded a 27% underperformance rate in 2025, extending a third consecutive year of majority outperformance after 30% in 2024 and 26% in 2023. Active A-REIT funds delivered their best relative year since 2013, with only 40% underperforming and an asset-weighted return of 11.7% against a benchmark gain of 9.2%. Meanwhile, Australian Equity General funds recorded a 74% underperformance rate against a long-term average of 60%. The market cap weighted equity index remains a formidable competitor. The fixed income benchmark, by contrast, is a duration-heavy construction that skilled managers can systematically improve upon by taking credit and curve positions the index doesn’t hold. That’s a benchmark design feature.
Small- and mid-caps the best equity class for active managers. The small- and mid-cap category had a 64% underperformance rate in 2025, but only because the S&P/ASX Mid-Small surged 21.5%, a hurdle few managers cleared. Over fifteen years the same category shows a 60% underperformance rate, the lowest of any equity category in the scorecard.
Survivorship is the number nobody quotes. SPIVA reported liquidation rates averaging 4% across categories in 2025. Over fifteen years, 52% of funds across all categories were merged or liquidated. More than half the funds an investor could have selected in 2010 no longer exist in their original form. Any performance table you look at that shows only surviving funds is, by construction, flattering.
Long horizons are unforgiving for most equity funds. Global Equity General funds exceeded 95% underperformance over both ten- and fifteen-year periods. When the same result appears across geographies and decades, the explanation is structural rather than cyclical: fees, the arithmetic of the aggregate market, and the difficulty of sustaining an edge as assets grow.
Use index exposure where the benchmark is efficient, capacity is deep and dispersion between managers is low. Reserve active risk and active fees for segments where the benchmark is flawed, information is scarce, or the opportunity set is genuinely inaccessible to an index: Australian small caps, credit, unlisted property, infrastructure, private markets. This is the core-satellite logic institutional asset consultants have applied for thirty years, and it survives contact with the SPIVA data far better than either extreme position.
Paying an active fee for index-like exposure is the worst of both outcomes. This is more common than most investors realise. Our Hidden Index Hugger Test sets out the diagnostics, principally active share, tracking error and the correlation of the fund’s excess return to obvious factor exposures. A fund with an active share below 60% against a liquid benchmark is, in most cases, an expensive index fund with a marketing narrative attached.
Fees: The Cost Investors Systematically Under-Emphasise
The management fee is the smallest and most visible component of the total cost of owning a managed fund.
The full cost stack includes the indirect cost ratio, performance fees and how their hurdle and high-water mark are defined, buy/sell spreads, explicit transaction and operational costs, platform or administration fees, and, for exchange quoted vehicles, the bid-ask spread and any premium or discount at the point of trade.
Comparing two funds on management fee alone will frequently rank them incorrectly.
Here’s the full cost stack:
Cost component
Where it appears
Typical magnitude
Why it is missed
Management fee
Fee table, front page
0.05% to 1.50% p.a.
Not missed, it is over-weighted
Indirect cost ratio
Fees and costs section
Adds 0.05% to 0.60% p.a.
Reported separately from the headline fee
Performance fee
Fee table, plus constitution
10% to 20% of excess return
Hurdle definition and high-water mark terms buried in the PDS
Buy/sell spread
Separate PDS section, updated periodically
0.05% to 0.60% each way
Not annualised, so it looks trivial
Transaction costs
Cost disclosure table
0.02% to 0.50% p.a.
Backward looking and often footnoted
Platform or wrap fee
Platform documents, not the PDS
0.15% to 0.60% p.a.
Charged by a different entity
Bid-ask spread and premium/discount
Not disclosed anywhere
0.05% to 1.00%+ per trade
Depends on your own execution
Three of these fees require specific attention:
Performance fee design is where the economics are decided. A 20% performance fee over a cash-plus-2% hurdle with a permanent high-water mark is very different from a 15% fee over a zero-hurdle reset annually. The first only pays the manager for return in excess of a credible alternative and requires prior losses to be recovered first. The second pays for market beta and allows the manager to be rewarded in year two for recovering the ground lost in year one. Yet, both may be described on a factsheet as a performance fee. In an environment where cash yields 4.35%, a hurdle set at a fixed 5% rather than a floating cash-plus margin has become much easier to clear.
The indirect cost ratio matters most in fund-of-fund and feeder structures. A feeder fund invests into a master fund, and fees can be charged at both levels. This can be an efficient structure, allowing a manager to consolidate capital and achieve scale, and vehicles such as the Zagga Feeder Fund in private credit use it for that reason. The investor’s task is to confirm the total look-through cost rather than the cost at the level they happen to be buying.
ETFs shift some costs from the fund to you. The management fee on an ETF may be lower than an equivalent unlisted trust, but you now bear a bid-ask spread on every trade and, for active quoted funds, exposure to any dislocation between market price and underlying value. In liquid conditions market makers keep this tight. In stressed conditions they widen.
In short, convert everything to an annualised, look-through basis at your actual expected holding period, then compare.
A fund with a 0.60% management fee, 0.15% ICR, 0.30% round-trip spread and a two-year expected hold costs 0.90% p.a.
A fund with a 0.75% management fee, no ICR, a 0.05% spread and a ten-year hold costs 0.76% p.a.
The instructive lesson in this example is that headline fee ranked them the wrong way round.
Liquidity: The Most Consequential Word in the Product Disclosure Statement
Liquidity in an Australian managed fund is a legal and operational construct, rather than a market fact.
A scheme is liquid under the Corporations Act if liquid assets account for at least 80% of scheme property.
If it is not liquid, redemptions can only occur through a withdrawal offer made at the responsible entity’s discretion, and there is no obligation to make one.
Many funds that offer monthly or quarterly redemptions in normal conditions are structurally capable of suspending them, and the constitution, not the marketing material, governs what happens.
This is arguably the most important input investors can internalise about unlisted funds, because this risk is invisible until it materialises.
For example, here are three funds sitting at different points on the liquidity spectrum:
The Trilogy Monthly Income Trust is a retail pooled mortgage trust with a $10,000 minimum, providing exposure to loans secured by first registered mortgages over Australian property, and is classified as unlisted liquid. The underlying assets are loans with contractual terms. The liquidity offered to investors is a function of the fund’s cash buffer, its loan maturity profile and continuing inflows.
The CFMG Land and Opportunity Fund, an unlisted scheme investing in residential land subdivision development, is classified as illiquid with a $25,000 minimum. Land subdivision takes years, so the fund’s honest illiquidity is a feature worth understanding prior to investment.
The Axon Capital Private Medical Property Trust, a wholesale trust with a $50,000 minimum acquiring a single private hospital asset, is similarly illiquid and additionally concentrated. Single-asset property trusts have a risk profile closer to direct property ownership than to a diversified property fund, and should be sized accordingly.
The framework that follows from this is intuitive.
Match the liquidity you are offered to the liquidity of what the fund owns, and treat any material gap as a risk you are being paid to bear rather than a free benefit.
A fund holding ASX-listed equities offering daily redemption has no mismatch.
A fund holding construction loans offering monthly redemption has a mismatch that is managed, not eliminated, and its magnitude depends on the cash buffer, the maturity ladder and, crucially, whether the investor base is diversified or concentrated in a handful of holders who might all move at once.
ASIC’s private credit surveillance has made liquidity stress testing an explicit expectation, alongside separation of the investment and valuation functions.
Both mean it’s reasonable for an investor to ask fund managers directly:
How often do you stress test redemptions?
Who signs off on valuations independently of the people who originated the assets?
For an SMSF trustee, there’s an additional dimension.
A fund’s investment strategy must consider the liquidity requirements of the fund, including the ability to pay benefits as members enter pension phase and to meet minimum drawdown obligations.
For example, a retiree drawing a pension who holds 30% of their portfolio in illiquid vehicles with no withdrawal window has a planning problem, regardless of how attractive the underlying assets are.
Tax: Attribution, Timing & the Division 296 Overlay
Australian managed funds are flow-through vehicles.
Under the Attribution Managed Investment Trust regime, the responsible entity attributes components of taxable income to unitholders, who are assessed on those amounts whether or not cash was distributed. Investors receive an AMMA statement after year end setting out the components, including franked dividends, franking credits, foreign income, foreign income tax offsets, capital gains eligible for the CGT discount, and any cost base adjustments.
This is more complex than owning shares directly and the complexity has real financial consequences.
There are four important implications:
You can be taxed on gains you didn’t enjoy. If you buy fund units in June, shortly before a large annual distribution, you receive a distribution comprising realised gains accumulated over the whole year, and you are taxed on them despite having held the units for weeks. The unit price falls by the distributed amount, so your economic position is unchanged, but your tax position is worse. This is the classic buy-the-distribution error. For a large investment, entering after the June distribution date rather than before it can be worth a meaningful sum.
Cost base adjustments are not optional and are easy to get wrong. Where the cash distributed differs from the taxable amount attributed, the AMIT rules adjust the unit cost base upward or downward. Tax-deferred distributions, common in property and infrastructure funds, reduce the cost base and increase the eventual capital gain. An investor who ignores this for a decade and then sells will materially understate their gain.
Structure interacts with turnover. In an open-ended unlisted fund, redemptions by other investors can force asset sales that crystallise gains distributed across all remaining holders. ETFs using an in-kind creation and redemption mechanism can, in some circumstances, reduce this effect. This is a second-order consideration for most investors and a first-order one for large taxable holders.
Division 296 has changed the calculus for large balances. From 1 July 2026 an additional 15% applies to earnings attributable to the portion of a total superannuation balance above $3 million, rising to an additional 25% above $10 million, with both thresholds indexed and the tax applied to realised earnings only. First assessments relate to the 2026-27 income year. Where an SMSF member sits above the threshold, a fund’s realised gain distributions now attract an incremental cost that did not exist a year ago. The behavioural risk here is over-correction. Tax should shape implementation, rather than dictate strategy. A low-turnover fund that is a poor investment does not become a good one because it defers realisation. The optimal sequence is to select on merit, then implement in the most tax-efficient structure and location available, then, only at the margin, allow tax to break ties between genuinely comparable options. Investors should confirm their position with a registered tax agent. The ATO’s managed investment trust guidance is the primary source, and Division 296 remains new enough that professional advice is warranted rather than optional for anyone near the thresholds.
Portfolio Role: Deciding What an Allocation Is For
Every managed fund in a portfolio should have a stated job, and that job should be expressed in terms of what it contributes to the whole rather than what it returns in isolation.
There are a handful of jobs to be aware of: generate growth, generate income, reduce drawdown, provide access to an otherwise unavailable return stream, or provide liquidity and ballast.
A fund that cannot be assigned one of these is a holding you own because you liked it, but which may not add value at a portfolio level.
The institutional habit worth borrowing is the distinction between strategic asset allocation, which is the long-run policy mix set by objective and risk tolerance, and implementation, which is the choice of vehicle.
Individual investors frequently invert this, selecting attractive-looking funds and then describing the resulting allocation as a strategy.
The consequences are: unintended factor concentration, correlated diversifiers, and a total portfolio risk profile that wasn’t deliberately chosen.
A workable structure for a self-directed Australian portfolio has three layers to it:
The core carries the majority of the capital and is long-term in nature. For example, broad Australian and global equity exposure, plus high-quality fixed income. This is where ETF exposure may be optimal, given the SPIVA evidence on benchmark efficiency.
The satellites carry deliberate active risk in segments where the evidence supports it and where the manager has a defensible edge. For example, Australian small caps, private credit, property, infrastructure, and private equity. Each position should be sized so that being wrong is survivable.
The defensive and liquidity sleeve exists to fund spending, meet pension obligations and give you the option to buy when others are forced to sell. This is where the current rate environment has changed the arithmetic most. Term deposits and cash funds are now a higher-yielding asset class rather than a residual, and the opportunity cost of holding a sensible liquidity buffer has fallen sharply.
Two principles govern how the layers fit together.
The first is that diversification is a correlation issue, rather than a count.
For example, six Australian equity funds are not a diversified portfolio. They are one exposure with six fee lines.
Genuine diversification requires return streams driven by different underlying factors, which in practice means looking to fixed interest, real assets, alternatives and, for those able to tolerate the liquidity terms, private markets.
The second is that in an illiquid allocation, position sizing is the primary risk control, because you cannot rebalance out of an illiquid position when your view changes.
Most institutional allocators cap total illiquid exposure by reference to future liabilities. A retiree with a five-year spending requirement should apply the same logic and let the drawdown profile, not the yield on offer, set the ceiling.
Where Managed Funds Earn Their Keep: An Asset Class Walk-Through
Managed funds add most value where the asset class is difficult to access directly, where security selection genuinely matters, or where the minimum efficient scale of an investment exceeds what an individual can commit. They add least value where a cheap index alternative delivers the same exposure.
Australian Equities
This is the hardest category for active management, and the one where the passive alternative is strongest.
SPIVA recorded 74% of Australian Equity General funds underperforming the S&P/ASX 200 in 2025 and 87% over fifteen years. The index is liquid, well researched and heavily concentrated in a handful of banks and miners, which makes it both easy to replicate and difficult to beat.
The more interesting opportunity sits further down the market capitalisation curve.
Australian mid and small capsshow the lowest fifteen-year underperformance rate of any equity category at 60%, consistent with a less efficient segment where research coverage is thinner.
Funds such as the Prime Value Emerging Opportunities Fund, a retail vehicle with a $20,000 minimum targeting medium to long term capital growth in smaller companies, and the wholesale Spatium Small Companies Fund, which runs a long-only portfolio of 25 to 40 positions across the ASX 300, illustrate the opportunity.
The suitability consideration is capacity and volatility.
Small-cap strategies tend to be capacity constrained, which is why the good ones often close, and they draw down harder than the index in stress.
Hence, they belong in the satellite layer, sized to be held through a bad three-year period rather than abandoned in one.
Australians remain structurally under-diversified offshore, in part because franking credits create a domestic bias, and, in part, through familiarity.
The counterweight is that the ASX represents 2% of global market capitalisation and is heavily concentrated in financials and resources.
Active global management has a challenging track record with 70% underperformance in 2025 and above 95% over ten and fifteen years.
That argues for index exposure at the core.
Where active funds can earn their fees is in less-covered global segments.
For example, the Artisan Global Discovery Fund, which invests in global small- and mid-cap companies with a $5,000 retail minimum, sits in that space.
The currency decision is separate and frequently neglected.
Unhedged global equity has historically provided a useful cushion in risk-off periods, because the Australian dollar tends to fall when global equities do, while hedged exposure removes that cushion and the associated volatility.
Fixed Income
This is the category where the active evidence is most supportive, and where investor understanding is weakest.
Active Australian bond fundsunderperformed at a rate of just 27% in 2025, extending three consecutive years of majority outperformance, returning 4.0% asset weighted against 3.2% for the benchmark.
Fixed income is also where the current environment may offer attractive opportunities for active managers.
With the cash rate at 4.35% and the RBA signalling that it could raise again if upside inflation risks materialise, duration positioning carries risk and opportunity.
Investors should be clear which of the three roles they want from a bond allocation: income, capital stability, or negative correlation to equities in a downturn.
A credit-heavy portfolio delivers income but correlates with equities in stress.
A long-duration government portfolio delivers the crisis hedge but has delivered painful capital losses in a rising rate cycle.
The bond fund and diversified income categories contain both, and the distinction is not always visible from the name.
Property
Australian investors typically hold too much property in aggregate, given the residential exposure most already carry, and too little diversity within it.
Unlisted property funds give a smoother reported return series, which is partly a valuation artefact rather than a genuine risk reduction, and materially worse liquidity.
Active management had an unusually strong year here in 2025, with only 40% of A-REIT funds underperforming, the best result since 2013, though 88% underperformed over fifteen years.
Within unlisted property, the distinction that matters most is between diversified funds and single-asset trusts, and between stabilised income assets and development exposure. A government-tenanted office portfolio and a residential land subdivision fund are both property funds, yet they share almost no risk characteristics.
Infrastructure
This is a genuine diversifier when the underlying assets have regulated or contracted revenues, inflation linkage and high barriers to entry.
Listed infrastructure behaves more like equities in the short term while unlisted infrastructure offers the return stream most investors are actually seeking, at the cost of long lock-ups and high minimums.
Energy transition assets have expanded the opportunity set considerably, including clean energy infrastructure funds providing exposure to development, construction and operational renewable projects.
The suitability question is whether you are being compensated for construction and merchant price risk or for owning stabilised, contracted cash flows. These are different investments with the same label.
Private Credit
This is the fastest growing category on the platform, and the one requiring the most rigour.
The economic case is real: floating rate exposure that benefits when the cash rate rises, contractual income, security over assets, and a genuine illiquidity premium.
The risk is that the reported volatility is low because the assets are marked infrequently, not because the risk is low.
The MaxCap Investment Trust High Yield, a wholesale real estate credit fund with a $100,000 minimum, sits at the institutional end of the market.
Retail-accessible mortgage funds sit at the other.
The difference in underwriting discipline, borrower quality and loan-to-value discipline across that range is far greater than the difference in advertised yield.
Given ASIC’s findings, an investor’s minimum diligence should cover: how loans are valued and by whom, whether the valuation team is separate from the origination team, the loan-to-value distribution and whether valuations are ‘as is’ or ‘as if complete’, arrears and default statistics presented consistently over time, related party exposures, the fee and interest margin the manager retains versus what is passed to investors, and the results of liquidity stress testing.
Where a manager can’t answer these quickly and thoroughly, that is itself an answer.
Private Equity & Venture Capital
This has the longest horizon and widest dispersion of any category.
Access is the central problem for individuals, and it is solved either by listed vehicles with permanent capital, or by unlisted funds with multi-year commitment periods and capital call mechanics that require careful cash management.
The private equity category is worth approaching with a clear view that manager selection, rather than asset class exposure, tends to drive the outcome.
Alternatives, Hedge Funds & Long-Short Funds
The purpose of this allocation is to change the shape of portfolio returns rather than to maximise them.
A long-short strategy such as the QVG Long Short Fund, a wholesale vehicle with an all-cap mandate able to profit from both rising and falling share prices, has a different return driver from a long-only fund.
The test to apply is checking the correlation to your existing equity exposure through a full cycle, and whether the fee structure leaves enough of the excess return with you.
Gold has behaved as a genuine diversifier during recent periods of geopolitical and monetary stress, with central bank buying an important structural support.
It produces no income, which means the entire return is price dependent and the opportunity cost rises with the cash rate.
Access ranges from physically backed commodity ETFs to miner equity exposure, which behaves as leveraged, operationally risky equity rather than as bullion.
Conflating the two is a common and expensive error.
Diversified & Multi-Asset Funds
For investors who want the allocation decision outsourced, multi-asset portfolios and diversified funds offer a professionally managed mix.
The industry convention of growth, balanced and conservative labels is a rough guide at best: a ‘balanced’ fund holding around 70% in growth assets is a substantially riskier proposition than the word suggests to most retirees.
Look at the actual growth-defensive split and the treatment of unlisted assets within it, not the label.
A Ten-Point Due Diligence Framework
Assessing a managed fund well requires answering ten questions in order:
What is the mandate? Look beyond the marketing description to the constitutional limits: permitted assets, concentration limits, leverage, currency policy, cash range.
Who is the responsible entity and who is the investment manager? Are they related? What is the financial strength of each? Who holds the licence?
What is the source of return? Identify whether it comes from market beta, a factor tilt, genuine security selection, an illiquidity premium, or leverage. Investors frequently pay active fees for factor exposure available cheaply.
Is the edge repeatable and does it survive scale? A strategy dependent on small-cap illiquidity doesn’t tend to scale well. Ask what the manager’s capacity limit is and whether they have ever closed a strategy.
What is the full look-through cost at my expected holding period? Check ICR, spreads, performance fees and platform costs.
How is the performance fee calculated? Look into hurdle definition, high water mark permanence, crystallisation frequency, treatment on partial redemption.
What does the performance record show once you adjust for survivorship, benchmark choice and risk? Compare to a well-chosen benchmark and to the cash rate. Examine the worst drawdown and its recovery period, not just annualised returns.
What are the liquidity terms in stress, not in normal conditions? Check constitutional suspension powers, notice periods, gating provisions, historical use of them.
How are assets valued, how often, and by whom? Independence of the valuation function is the key question for anything unlisted.
What is the tax profile? Check turnover, franking, tax-deferred component, distribution timing, and whether that profile suits the entity holding the units.
Performance is question seven, not question one, because a return series tells you what happened without telling you whether it will repeat.
An eleventh question is worth adding for anyone who has been investing long enough to have made mistakes: what would have to be true for me to sell this? Deciding the exit condition before entering is a reliable defence against holding a broken thesis for a decade.
Comparison Frameworks
ETFs Versus Unlisted Managed Funds
Consideration
Exchange quoted
Unlisted
Access
Any broker, one unit minimum
Application form or platform, $5,000 to $250,000
Pricing
Continuous, intraday
Daily, weekly or monthly NAV strike
Transaction cost
Brokerage plus bid-ask spread
Buy/sell spread
Transparency
Holdings often daily or near-daily
Typically, monthly or quarterly, top ten only
Strategy range
Constrained by the need for intraday pricing
Can hold genuinely illiquid assets
Behavioural risk
Ease of trading encourages overtrading
Friction discourages it
Best suited to
Liquid, scalable core exposures
Capacity-constrained or illiquid strategies
The behavioural point is underrated.
The frictionlessness of ETFs is a benefit when you need to act and a liability when you merely want to. Research on retail trading behaviour is consistent on this.
Listed Versus Unlisted Access to Illiquid Assets
Consideration
LIC / LIT
Unlisted open-ended fund
Capital base
Fixed, permanent
Variable with flows
Exit
Sell on market, immediate
Redemption window, may be suspended
Price risk
Discount or premium to NTA
Priced at NAV, but NAV may be stale
Manager behaviour in stress
No forced selling
May need to sell to fund redemptions
Dilution risk
Capital raisings can dilute
Flows can dilute existing holders
Transparency
Continuous disclosure, NTA reporting
Periodic reporting
Active Versus Index Allocation Decision
Condition
Favours index
Favours active
Benchmark efficiency
High, well researched
Poor construction or unrepresentative
Manager dispersion
Narrow
Wide
Fee differential
Large
Small relative to opportunity
Capacity
Deep
Constrained, edge is scarce
Access
Fully replicable
Asset class inaccessible passively
Example categories
Large-cap Australian and global equity
Small caps, credit, unlisted property, infrastructure, private markets
Common Mistakes Investors Make
The costly errors in fund investing are rarely errors of analysis. They are errors of process, sizing and self-knowledge, and they persist among experienced investors because experience creates confidence.
Here are some of the most common:
Chasing the top of the performance table. Recent outperformance is weakly predictive at best. S&P’s persistence research consistently finds that top-quartile status in one period is a poor guide to the next. The reason is simple: strong returns attract flows, flows expand the asset base, and scale erodes the very edge that produced the returns.
Mistaking smooth reported returns for low risk. An unlisted asset marked quarterly by the manager will exhibit lower reported volatility than a listed equivalent with identical economics. This is a measurement artefact. Portfolio optimisers fed with these numbers will systematically over-allocate to unlisted assets, which is the main reason institutional allocators apply valuation lags and de-smoothing adjustments before running the analysis.
Diversifying by count rather than by driver. Twelve funds with overlapping factor exposures is not diversification. Look through to the underlying exposures and, where possible, to the actual holdings.
Ignoring the liquidity ladder against future liabilities. The relevant question is not whether an illiquid fund is a good investment, but whether you can afford to be unable to access that capital for the maximum plausible period, including a period of market stress during which withdrawal offers are suspended.
Under-reading the constitution and over-reading the factsheet. The factsheet describes intentions. The constitution and PDS describe rights. In a dispute, only the second matters.
Treating a wholesale classification as a statement about your capability. Qualifying by asset test says something about your balance sheet, not your analytical resources.
Allowing tax to drive investment selection. A tax-efficient poor investment is still a poor investment. Division 296 makes this temptation stronger for large balances and it should be resisted at the level of strategy, then acted upon at the level of implementation.
Failing to define a sell discipline. Most investors have entry criteria and no exit criteria, which converts every underperforming holding into an open-ended question and, eventually, into a sunk-cost problem.
Outlook: What Changes from Here
Three developments are likely to shape Australian managed fund investing over the next few years.
On rates, the immediate question is whether the RBA delivers a further increase in late 2026. The forecasting divergence between the major banks is unusually wide, which is itself informative: consensus is weak because the data is mixed, with headline inflation easing to 3.5% while trimmed mean inflation holds at 3.6% and the labour market remains firm. For investors the best response is to ensure your portfolio doesn’t depend upon a single rate path.
On regulation, the direction is clearer. ASIC has committed to further surveillance of the funds management sector in 2026, with specific attention to fees, margin structures and conflicts management in wholesale private credit funds, and to how private credit is distributed to retail clients through direct and advised channels. Design and distribution stop orders have already been issued. The consequence for investors is likely to be positive: better standardised reporting, clearer valuation disclosure, and attrition among weaker operators. In the short term, though, some funds will look worse once they report honestly. Investors should read a deterioration in their disclosed metrics as improved transparency rather than assume it reflects new deterioration in the assets.
On structure, the boundary between listed and unlisted continues to blur. Active ETFs, dual-class structures and managed accounts have made the access mechanism increasingly independent of the investment strategy. This is an improvement in investor choice, but it also raises the analytical burden, because the question ‘is this an ETF or a managed fund’ means a lot less.
The one thing unlikely to change is the arithmetic. Costs compound. The aggregate market cannot outperform itself, and the majority of active funds will continue to underperform over long horizons while a minority will not. The task is to allocate deliberately knowing this.
Conclusion
The managed fund decision has become a structure decision more than a product one.
Two funds pursuing an identical strategy can deliver very different outcomes to the same investor depending on how they are wrapped, priced, taxed and redeemed. That was always somewhat true. With cash yielding 4.35%, private markets under regulatory scrutiny and Division 296 now live, the differences have become large enough that they dominate the ordinary variation in manager skill.
The best response is to decide your allocation before selecting your funds or ETFs.
Index the efficient parts of the market and pay for active risk only where the evidence and the opportunity set support it.
Compute the full look-through cost at your real holding period.
Match liquidity to liabilities and treat every mismatch as a priced risk.
Read the constitution.
Define your exit before your entry.
And revisit your strategy on a schedule rather than in response to a market sell-off.
Frequently Asked Questions
A managed fund is a pooled investment vehicle, usually a unit trust registered as a managed investment scheme, operated by a responsible entity that holds an Australian Financial Services Licence.
Investors contribute capital in exchange for units representing a proportional interest in the fund’s net assets, and a professional manager invests according to a defined mandate.
The distinction from owning shares directly is that you own an interest in a pool rather than in specific assets, and the fund’s income and capital gains are attributed to you for tax purposes as components rather than as dividends.
That flow-through treatment is the reason the tax reporting is more complex.
Neither is inherently better, because the comparison confuses structure with strategy.
An ETF is an access mechanism, and a substantial and growing share of exchange quoted funds in Australia are actively managed.
The useful comparison is between a liquid, scalable strategy that can be delivered through an exchange quoted wrapper, and a capacity-constrained or illiquid strategy that cannot.
Management fees typically range from about 0.05% p.a. for large index funds to around 1.50% p.a. for specialist active strategies, but the management fee is not the total cost.
A complete calculation adds the indirect cost ratio, disclosed transaction costs, the buy/sell spread amortised over your holding period, any performance fee, and platform or administration fees charged separately by a wrap or investment platform.
An investor holding a fund for two years with a 0.30% round-trip spread is paying an additional 0.15% p.a. Over ten years the same spread costs 0.03% p.a.
Holding period changes the ranking of otherwise similar funds.
Most do not, and the proportion that fails rises with the time horizon.
The SPIVA Australia Scorecard for year-end 2025 found 74% of Australian Equity General funds underperformed the S&P/ASX 200 over one year and 87% over fifteen years. Global Equity General funds exceeded 95% underperformance over ten and fifteen years.
The exceptions are systematic rather than random.
Active Australian bond funds underperformed at only 27% in 2025, a third consecutive year of majority outperformance, and Australian Equity A-REIT funds recorded a 40% underperformance rate, their best relative result since 2013.
Australian mid and small cap funds show the lowest fifteen-year underperformance rate of any equity category at 60%.
Where the benchmark is less efficient or the opportunity set is less researched, active management has a better record.
Not necessarily. This is the most important thing to check before investing.
A scheme is ‘liquid’ under the Corporations Act if liquid assets represent at least 80% of scheme property.
Where a scheme is not liquid, investors can only withdraw if the responsible entity chooses to make a withdrawal offer, and there is no obligation to make one.
Even funds that offer monthly or quarterly redemptions in ordinary conditions generally retain constitutional powers to suspend or stagger withdrawals.
Funds holding development assets, construction loans or direct property are commonly classified as illiquid from the outset, which is appropriate given what they own.
The risk to avoid is a fund whose stated redemption terms are more generous than the liquidity of its underlying assets can support in a stressed market.
Each fund attributes components of taxable income to you, and you are assessed on those amounts whether or not equivalent cash was paid.
After year end, you receive an AMMA statement setting out the components: Australian income, franked dividends and franking credits, foreign income and foreign income tax offsets, capital gains including amounts eligible for the CGT discount, and tax-deferred amounts.
Two consequences catch investors out.
First, tax-deferred distributions reduce your unit cost base and therefore increase your eventual capital gain on sale.
Second, buying units shortly before a large annual distribution means being taxed on gains realised before you invested.
Confirm your position with a registered tax agent and consult the ATO’s guidance on managed investment trusts.
It varies by structure and investor classification.
Retail unlisted funds commonly start between $5,000 and $25,000.
Wholesale funds, available only to investors who meet the wholesale client test, typically require $50,000 to $250,000.
ETFs can be bought for the price of a single unit.
Minimums are not a proxy for quality. They reflect the administrative cost of servicing an investor and the regulatory category the fund operates in.
They are widely used by SMSFs, particularly to access asset classes that trustees cannot practicably invest in directly, such as global equities, credit, infrastructure and unlisted property.
The trustee obligations that follow are the important part.
An SMSF’s investment strategy must address diversification, risk, return, and the fund’s liquidity and ability to discharge liabilities, which for a fund in pension phase includes meeting minimum drawdown requirements.
Holding a significant allocation to funds with no available withdrawal window creates a real planning constraint.
From 1 July 2026, Division 296 adds a further consideration for members with balances above $3 million, since realised earnings attributed to the excess proportion attract additional tax.
A retail fund is offered to the general public, must be supported by a product disclosure statement, and is subject to design and distribution obligations that require the issuer to define a target market.
A wholesale fund is offered only to investors meeting the wholesale client test, usually by holding net assets of at least $2.5 million or income of at least $250,000 for two consecutive years with an accountant’s certificate, or by investing $500,000 or more.
Wholesale funds carry lower disclosure obligations and often lower operating costs, and can pursue strategies that are impractical to offer through a retail PDS. The trade-off is that the investor receives materially less regulated protection.
Compare them on total look-through cost at your expected holding period, on the source and repeatability of returns rather than the returns themselves, on risk-adjusted performance against a correctly chosen benchmark and against the current cash rate, on the worst historical drawdown and its recovery period, on liquidity terms in stressed conditions rather than ordinary ones, on the independence of the valuation process for any unlisted assets, and on the tax profile relative to the entity that will hold the units.
Performance ranking alone is the least reliable criterion, because it is influenced by the market environment during the measurement window and by survivorship in the comparison set.
Private credit doesn’t have a single risk profile, and the range within the category is wider than the range between most other asset classes.
Well-underwritten senior secured lending at conservative loan-to-value ratios against income-producing assets is a genuinely defensive exposure. Subordinated construction finance against pre-development land at high gearing is not, even where both are marketed under the same category heading.
ASIC’s 2025 surveillance of 28 private credit funds identified inconsistent reporting, opaque fee and margin structures, weak governance and poorly managed conflicts, and found that fewer than half the funds reviewed had detailed written default management policies.
The regulator has made poor private credit practices a 2026 enforcement priority.
Investors should require clarity on valuation methodology and independence, loan-to-value distribution and whether valuations are struck ‘as is’ or ‘as if complete’, arrears and default history, related-party exposure, and liquidity stress testing.
It means a fund doesn’t satisfy the statutory liquidity test, so investors have no right to redeem on demand and can only exit if the responsible entity makes a withdrawal offer, or through a secondary transfer if the constitution permits one.
In practice, this typically applies to funds holding direct property, development projects, private company equity or long-dated loans.
The classification is a disclosure, rather than a warning. Illiquidity is often the reason the return premium exists.
The error is holding illiquid assets against short-dated liabilities.
Simon Turner is an ex-fund manager with 20 years investing experience gained at Bluecrest, Kempen and Singer & Friedlander who now writes educational content about investing and sustainability. He's also the published author of The Connection Game and Secrets of a River Swimmer.
The Premium Income Fund offers Retail and Wholesale Investors the opportunity to invest in a pool of commercial loans, secured by mortgages over real Australian property.
The Fund provides secured debt facilities to non-bank lenders and corporates with physical and/or financial assets that can provide asset backing. (For Wholesale Investors Only)
The Fund offers exposure to real world assets in digital token form, through the creation of digital (investible) twins for the real world assets. (For Wholesale Investors Only)
The ASF aims to provide Eligible Investors with access to a portfolio of ASX listed equity securities outside the S&P/ASX 100 Index. The portfolio may also have some exposure to ASX listed securities and global companies. (Wholesale Investors Only)
The Fund aims to provide long-term capital growth through a portfolio of global equities. The team uses a fundamental, bottom-up approach, driven by valuation, building a concentrated, 'best ideas', high conviction global equity portfolio.
The portfolio provides investors with access to institutional quality renewable energy assets, spanning multiple technologies, and multiple jurisdictions.
The Fund combines the skills of highly experienced small company investors with a limited fund size and an objective of providing above market returns over the medium term.
To provide long-term capital growth by investing in a portfolio of life science companies where innovation plays a crucial role in improving global health and economic outcomes.