-vmtf4wo29a20xxj6oknl.png)
The Best 12 Months for Equities Usually Starts Now: Will the US Midterm Pattern Recur?
During a news-heavy year, Americans vote in their midterm elections on Tuesday 3 November.
If history is any guide, Australian investors with money in US equities could be approaching the sweetest stretch of the four-year political calendar.
Since 1950, the S&P 500 has risen in the year after every single midterm election, by an average of 15%.
Few market patterns are so consistent, which is why this one deserves a closer look.
We’ve analysed the numbers from raw data and found three reasons why 2026 may not follow the same script…
Key Takeaways
- The S&P 500 has been higher 12 months after all 19 midterm elections since 1950 on election-day figures, gaining an average of 15%, about double the average return in other years.
- Before 1950 the pattern didn’t exist: in the 12 midterms from 1902 to 1946, stocks fell in the following year six times.
- The rally has historically been strongest after weak midterm years. In 2026 the S&P 500 is up about 12% heading into the vote, and years like that have produced average gains of 11.8%, not 18.4%.
- However, a Shiller CAPE above 40, a 10-year Treasury yield above 5% and inflation at 3.7% make this an unusually demanding starting point.
- For Australian investors, the prudent response may be to check their diversification, currency exposure and rebalancing rules.
Explore 100's of investment opportunities and find your next hidden gem!
Search and compare a purposely broad range of investments and connect directly with product issuers.
What the Midterm Pattern Shows
The headline historical data tells a consistent story.
The S&P 500 rose in the year after all 19 midterms from 1950 to 2022, with an average gain of 15.1% and a median rise of 14.5%.
Capital Group puts the average one-year gain since 1950 at 15.4%, ‘nearly twice the return of all other years during a similar period’.
On election-day figures, the worst result was a 1.1% rise after 1986, a period encompassing the 1987 crash.
We cross-checked this with Shiller’s monthly S&P 500 data. Measuring from November of each midterm year to the following November, the average gain since 1950 was 14.9% and the median 14.4%, with 18 rises and one essentially flat year: 1986, when the index slipped just 0.04% on monthly average prices, excluding dividends.
By comparison, the November-to-November returns of all other years over the same period averaged just 7.4%.
So, the pattern is real. At least in the post-war data.
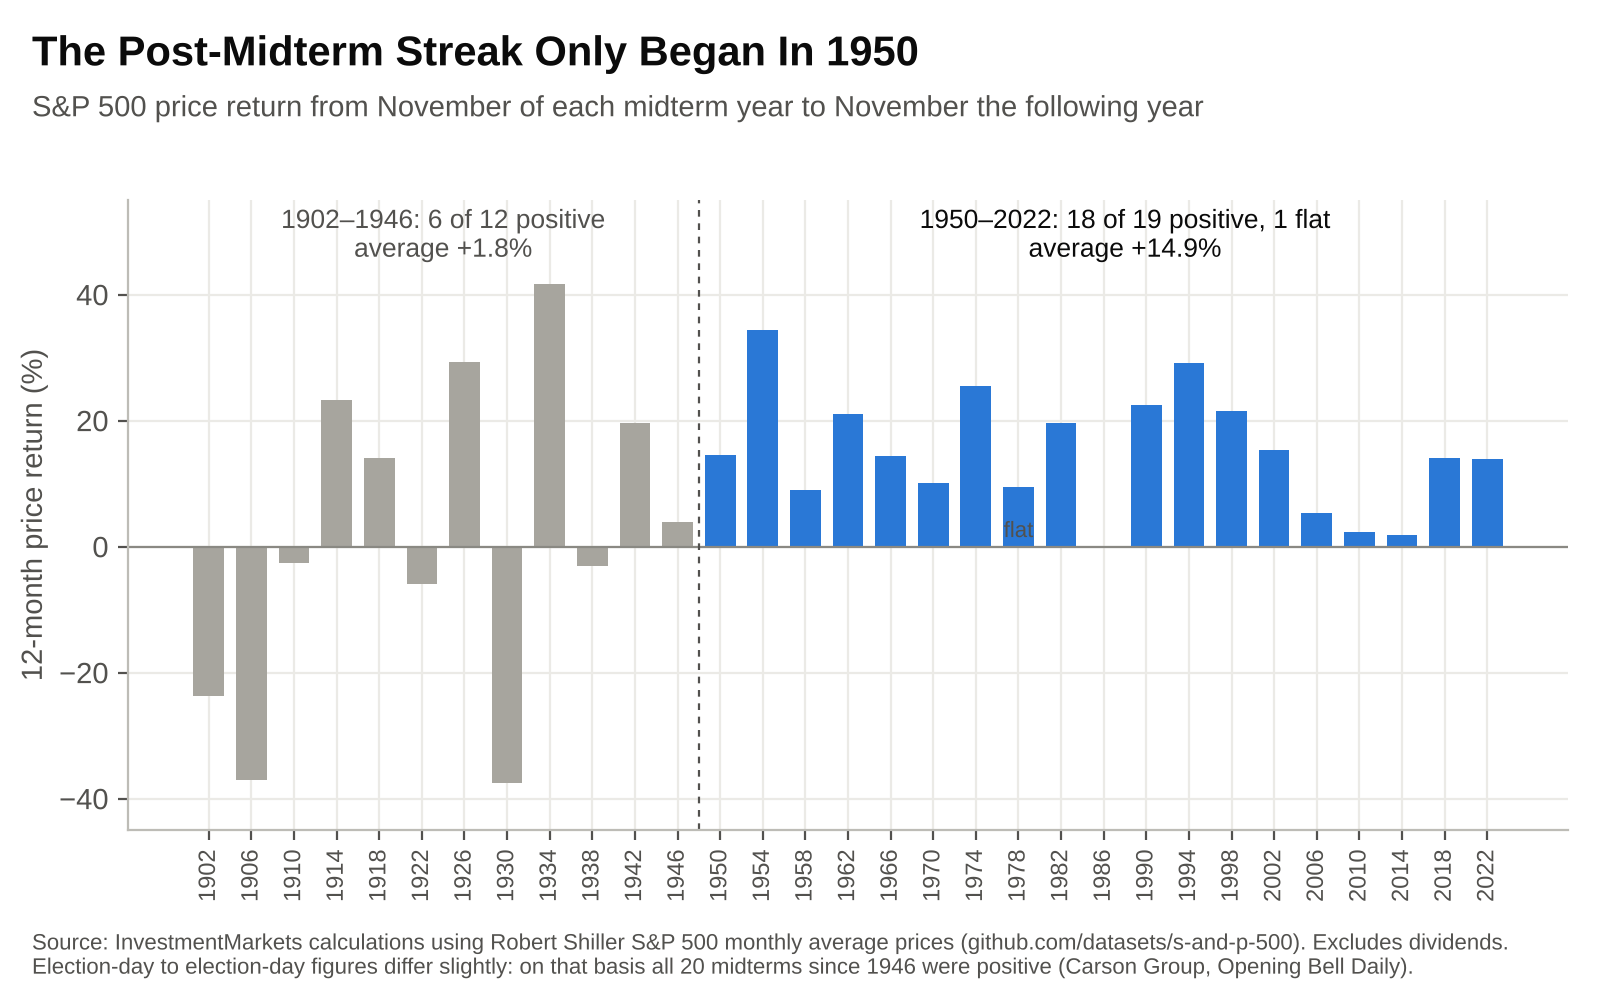
The midterm effect is a post-war phenomenon.
Source: InvestmentMarkets calculations using Robert Shiller S&P 500 data.
Why It Has Worked in the Past
Midterm years tend to be the most uncomfortable of the political cycle.
Capital Group found that the S&P 500 has averaged 4.7% in midterm years since 1930, against 9.5% in other years. Midterm years have also been more volatile: since 1970, their median standard deviation of returns has been nearly 16%, against 13% in other years.
According to LPL Financial, the average peak-to-trough fall within a midterm year has been more than 17%, the deepest of any year in the presidential cycle.
The reason is simple: once the votes are counted, a major source of the uncertainty disappears.
The president’s party usually loses seats (an average of 27 in the House over the past 23 midterms), which produces political gridlock. Markets tend to tolerate that well as it forces a degree of stability.
More positively, although Trump cannot run again in 2028 under the US Constitution’s two-term limit, he and his party have every incentive to keep the economy humming before the next presidential election (e.g. his pledge of a US$5,000 payment to every adult if Republicans hold Congress).
Subscribe to InvestmentMarkets for weekly investment insights and opportunities and get content like this straight into your inbox.
The Limits of a 19-Game Winning Streak
With three in four years producing a gain in the S&P 500, as has been the case since 1950, the odds of 19 wins in a row arising by pure chance are well under 1%.
In other words, this is a pattern which strategists take seriously.
Go back further in time, though, and the magic vanishes.
Our analysis of the 12 midterms between 1902 and 1946 shows the market fell in the following year six times, including slumps of 37% after 1906 and 1930.
The average gain was still positive, albeit anaemic, at 1.8%.
How should we interpret this decidedly different average?
After all, a pattern that only works in one era could be a reflection of that era, rather than a market guarantee. Post-war growth and a more activist Federal Reserve explain much of the more recent strength.
Three Reasons 2026 Could Break the Pattern
Before trusting this pattern as a predictor of what’s coming, it’s worth delving deeper into the three reasons why this year may be different:
1. No Major Midterm Sell-Off to Recover From
The best post-midterm rallies have erupted off a low base.
In 1974, 2002 and 2022, the market was down more than 20% by October and then surged.
This year, the S&P 500 hit a record close of 7,818.93 on 6 October and was up 11.9% for the year by mid-October, with its deepest fall only 9.1%, about half the typical midterm drawdown.
That’s valuable context.
When we split the post-war midterms by how the market performed into October, years in which shares were already up more than 5% went on to deliver an average 11.8% return over the next 12 months.
In contrast, years that arrived bruised delivered 18.4%.
The weakest post-midterm results, in 1986, 2010 and 2014, all followed strong runs into the vote.
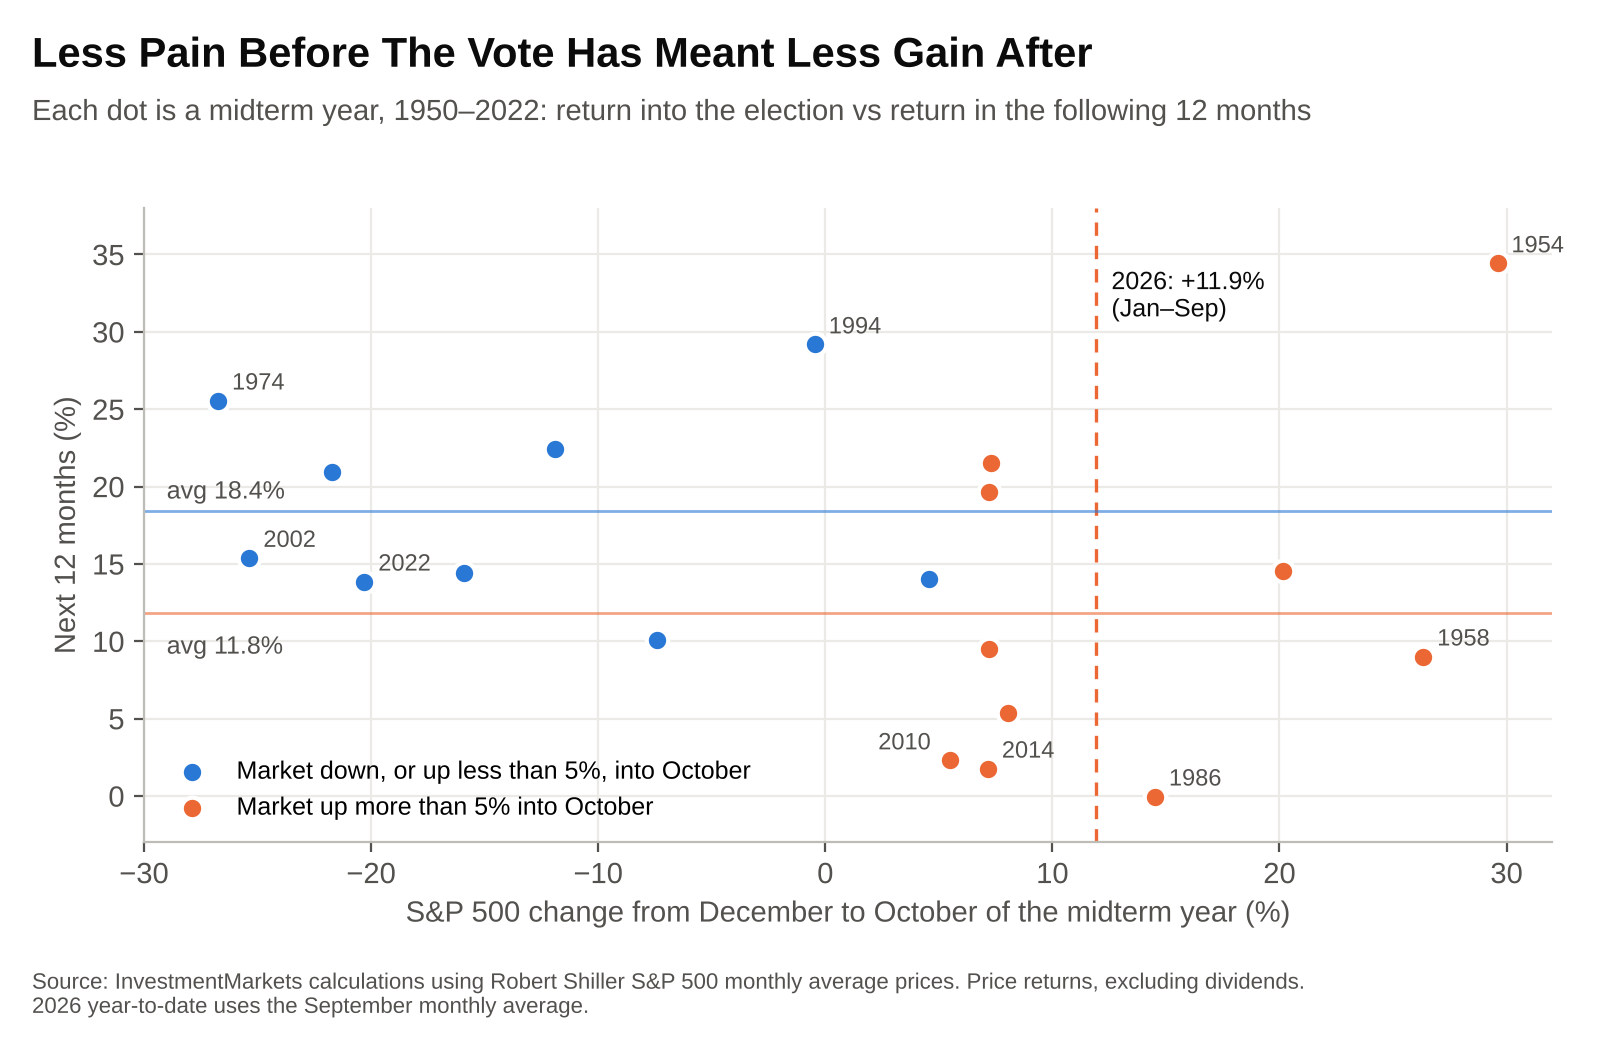
The rally has been strongest after painful midterm years.
Source: InvestmentMarkets calculations using Robert Shiller S&P 500 data.
2. Valuations Leave Minimal Room for Error
Valuation also provides useful context.
US equities are currently on the expensive side.
The Shiller cyclically adjusted price-to-earnings ratio sat at 42 in early October, within sight of the dot-com peak of 44.2 and well over twice its long-run average of about 17.
No post-war midterm started from anywhere near today’s valuations. The closest, 1998, had a CAPE of about 34 in October, and the rally that followed ended in the 2000 crash.
3. Rates, Inflation and Politics Are All Moving in the Wrong Direction
Rates have also played a major role in the past.
In short, midterm rallies have usually been helped by steady or falling interest rates.
2026 is proving less helpful on that front.
The Federal Reserve recently resumed hiking, US headline inflation rose to 3.7% in September as the Iran conflict pushed up energy prices, and the 10-year Treasury yield has broken through the ominous 5% barrier.
As we noted in What Happened to Shares When the US 10-Year Treasury Yield Hit 5% in the Past?, a 5% risk-free rate creates serious competition for equities.
On top of that, the upcoming election itself carries more uncertainty than usual.
By way of background, Decision Desk HQ gives the Democrats a 77% chance of winning the House and 56% for the Senate (as at 17 October).
Some advisers, such as Defiant Capital Group, warn that a disputed result could unsettle the markets.
However, political gridlock has historically been benign. In the words of Capital Group’s Chris Buchbinder:http://google.com/goto?url=CAESqgEB6zswFVYAWL56KAh5PS9eJlk7b1662H4c79ZfoRPLOTY-Kmoq_6EBRvZK5wFAr_xTSBBi6Rd7NSSVSi6F0YJ_XmBWpxdQueopzxbsZIRnhQacFhN4wM9zQlEKYKiRHsDtNjeDFzOfn_wjwLA7fFI7XBVewOei4BZCDMZPdZtHGb7H_EzFebDYPTtfBkCsQWy0Fb0aRduFyT6xdgRYy9q-tQbdfNLj3RBFHA ‘I don’t expect the election results to be a huge driver of investment outcomes one way or the other.’
Three Main Takeaways
There are three main takeaways for Australian investors:
1. Use currency to your advantage.
Unhedged US or global exposure, through funds such as the iShares S&P 500 ETF (IVV), has historically cushioned Australian investors during US sell-offs because the Australian dollar tends to fall in risk-off periods.
Currency-hedged ETFs, such as the iShares S&P 500 AUD Hedged ETF (IHVV), remove that buffer along with the currency risk.
2. Concentration risk deserves your attention.
The US result could affect Australian investors’ portfolios through their global ETFs and global equity funds, with US stocks making up three-quarters of a typical market-weighted developed-world index.
Now may be an ideal time to be aware of this concentration risk, and to take mitigating action if being overweight US big tech is not your intention.
Equal-weight ETFs and a fresh look at Australian ETFs are two ways to help rebalance that risk.
3. Defensive assets are paying again.
With the US 10-year Treasury yield above 5%, bond fund ETFs now offer genuine income generation potential alongside downside protection. Bear in mind that Australian bond yields differ from US yields, and unhedged US bond exposure carries currency risk.https://www.investmentmarkets.com.au/investments/bond-funds-etf
Gold ETFs have also earned a place for some investors as a hedge against the inflation and geopolitical shocks that have defined 2026.
Respect the Pattern Without Betting the House on It
The post-midterm pattern is one of the more robust calendar effects in finance.
As Opening Bell Daily put it, ‘history says the hard part of a midterm year usually comes before the ballots are counted, not after.’
But this year skipped the hard part. Shares go into the vote within a few per cent of record highs, with rates and inflation high and rising.
The most likely outcome for the ensuing year may still be positive returns, yet the odds of an above-average year look weaker than the headline data implies.
The smart move is to use this moment as a prompt for a portfolio risk check-in rather than a reason to add more risk.
Frequently Asked Questions
When Are the 2026 US Midterm Elections?
The US midterm elections are held on Tuesday 3 November 2026, which is Wednesday 4 November in Australia. All 435 House seats and about a third of the Senate are contested.
How Do US Shares Usually Perform After a Midterm Election?
Since 1950, the S&P 500 has risen in the 12 months after all 19 midterm elections, with an average gain of about 15% and a median of about 14.5%. The weakest result was a gain of about 1% after 1986 (essentially flat on monthly average prices).
Has the Midterm Pattern Ever Failed?
Not since 1938. Before then, it failed often: between 1902 and 1946, shares fell in the year after six of 12 midterms, including drops of about 37% after 1906 and 1930.
Does the US Midterm Election Affect the ASX?
Indirectly. The ASX 200 has tended to move with US shares during major shifts in global risk appetite, but local factors such as RBA policy, bank earnings and commodity prices usually matter more. Australian investors feel US outcomes most directly through global ETFs and global equity funds.
Should I Buy Shares Before the Midterms?
Calendar patterns are a weak basis for investment decisions, especially with a sample of 19 elections. A more robust approach is to set a target asset allocation and rebalance to it. This article is general information only and does not consider your personal circumstances.
Disclaimer: This article is prepared by Simon Turner. It is for educational purposes only. While all reasonable care has been taken by the author in the preparation of this information, the author and InvestmentMarkets (Aust) Pty. Ltd. as publisher take no responsibility for any actions taken based on information contained herein or for any errors or omissions within it. Interested parties should seek independent professional advice prior to acting on any information presented. Please note past performance is not a reliable indicator of future performance.
Author

Simon Turner
Head of Content (CFA), InvestmentMarkets
Related Articles
-c0r65slb5ciy1qtd4yd3.png)
-s5c0uf81il26meg3icyx.png)
Investments You May Like

Hamilton12 Australian Shares Income Fund
The Fund aims to generate long-term after-tax returns for Aust resident investors in excess of the Benchmark after fees, including an annual gross dividend yield (incl franking) that exceeds gross dividend yield of the Benchmark (Wholesale Investors Only)
Categories
Recent Articles
View all articles-kb76wojwxzr2l83lrgb4.png)
-rev76nk32o2qbrmnygt6.png)
-cjqoall8pxc4nlocz98x.png)