-w1ik9cv629m15fwry2zl.png)
Is This 1973 Again? Your Stagflation Survival Guide at a Time When It May Be Needed
October 2026 is a very different world in global markets to that of 2025. Brent crude is knocking on US$100 a barrel. The war in the Middle East continues to choke the world’s most important oil shipping lane, while the war in Ukraine grinds on in Europe. Central banks are raising interest rates into an energy shock rather than cutting to cushion it. For anyone who invested through the 1970s, the similarities are strikingly familiar.
Whilst the 1970s were different in some important ways, that decade offered hard evidence on which assets and investment styles protected real wealth when high inflation and weak economic growth arrived together. That evidence may be increasingly useful in in the months and years ahead…
Key Takeaways
- In the 1973 to 1974 crash, Australian shares fell almost 60%, or 67% after inflation.
- Across eight US inflation surges, shares, bonds and 60/40 portfolios delivered negative real returns on average.
- Commodities and trend-following strategies delivered positive real returns in every episode studied.
- Today’s economy is far less oil-dependent, but inflation risk is has evolved into a portfolio design question, rather than a tail risk.
- Real assets are volatile and partly priced for trouble, so diversified hedges beat a single big bet at this juncture.
Explore 100's of investment opportunities and find your next hidden gem!
Search and compare a purposely broad range of investments and connect directly with product issuers.
Why 1973 Keeps Popping Up as a Comparison
‘The past is our only real guide to the future, and historical analogies are instruments for distilling and organising the past and converting it to a map by which we can navigate.’ Michael Mandelbaum
It’s easy to see why 1973 is the analogy more investors are focusing on as 2026 reaches its final months.
In 1973, the Yom Kippur War prompted an Arab oil embargo that sent prices soaring.
Today, fighting between the US and Iran has left the Strait of Hormuz effectively closed, a disruption the International Energy Agency has warned could become the biggest oil supply shock on record.
The oil price is responding as it tends to when a supply shock emerges: it’s risen sharply.
Central banks are again tightening.
The Fed lifted its target range to 3.75% to 4%, with Chair Kevin Warsh explaining, ‘Inflation is too high and has been for too long.’
US inflation was 3.4% in the year to August 2026.
-iwnhxivwhkv1l1xoq3tr.png?_a=BAMAAAhM0)
Source: Trading Economics
Local inflation also remains higher than the RBA’s 2–3% target range, at 3.5% in the year to July 2026.
-jqqpr92hypqslq0i9dli.png?_a=BAMAAAhM0)
Source: Trading Economics
RBA Governor Michele Bullock is painfully aware that Australia’s battle with inflation is far from over. She told a parliamentary committee that some of the upside inflation risks flagged in August appeared to be materialising. The RBA has already lifted the cash rate by a cumulative 100 basis points this year and remains as hawkish as ever. Their September rate rise and supporting rhetoric didn’t make comforting reading for mortgagees around the country.
But This Is Not a Carbon Copy of the 1970s
It has to be added that the global economy looks very different now compared with 1973, particularly in relation to oil intensity.
There’s been a more than 70% fall in the oil intensity of economic output since the 1970s, so each dollar added to the oil price does less damage.
Inflation is also much lower. Australian inflation peaked at 17.6% in the year to March 1975. That’s around five times higher than it is at present.
Independent, inflation-targeting central banks are themselves a legacy of that era.
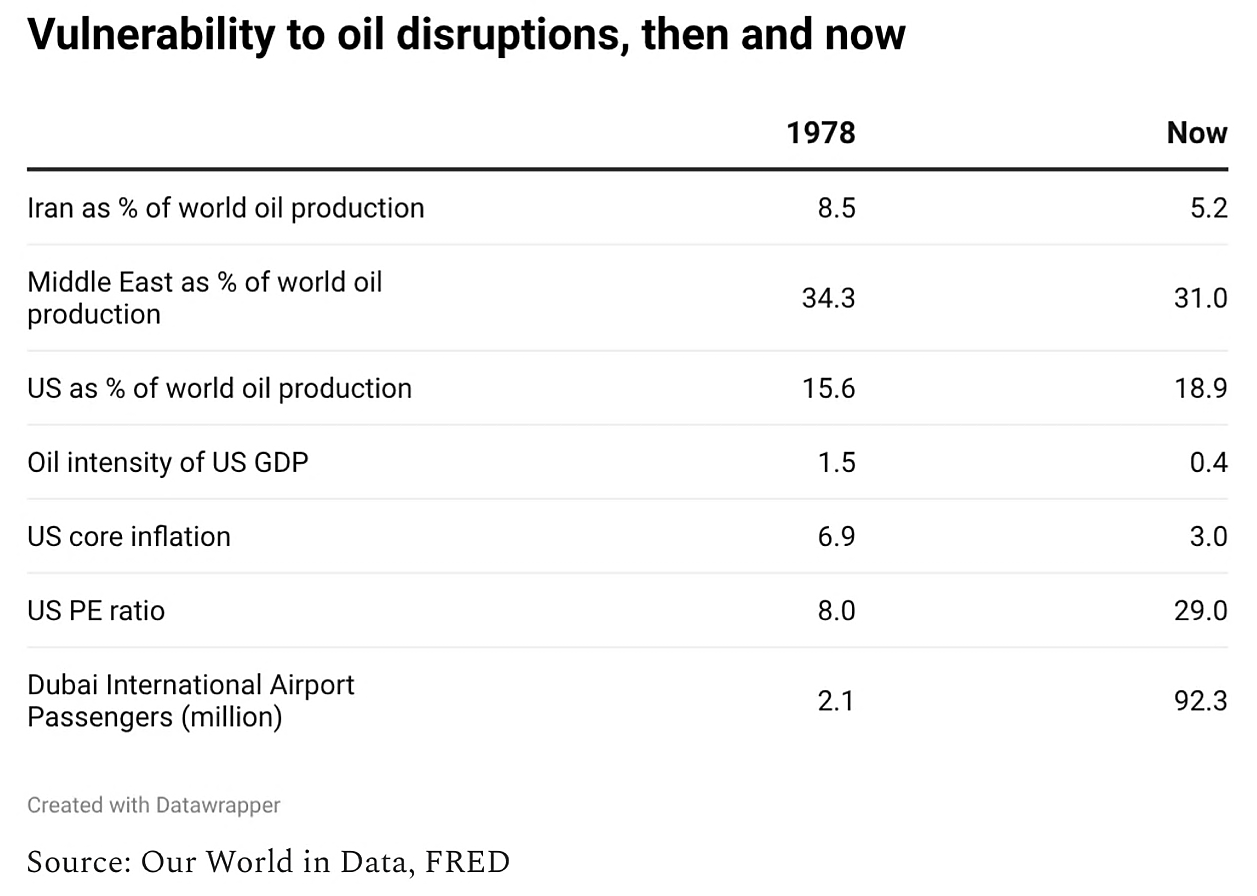
Source: Paul Krugman
‘Almost everyone assumes that the economic fallout from Operation Epic Fury will be much less severe than the fallout from the rise of the mullahs nearly fifty years ago. And they’re probably — probably — right.’ Paul Krugman
Paul Krugman makes a valid point: the war with Iran is not generally expected to have impacts as severe as those of the 1979 Iranian Revolution.
The more telling warning sign is consumer expectations.
Australian consumers now expect inflation of 4.9% p.a., according to the Melbourne Institute’s August 2026 survey, up from 3.9% in August 2025.
It was this entrenching of higher inflation expectations, rather than the 1970s oil shocks per se, that allowed stagflation to do its worst for a decade.
So, even accepting all the obvious differences, this is an important similarity with the 1970s that warrants investors’ awareness.
Subscribe to InvestmentMarkets for weekly investment insights and opportunities and get content like this straight into your inbox.
How the 1970s Ravaged Traditional Portfolios
So, what happened to global markets during the stagflation of the 1970s?
Both halves of balanced portfolios suffered.
The All Ordinaries fell 59.8% to September 1974, or 67% after inflation, the deepest real crash in Australian market history. Bonds offered no shelter, with 10-year yields climbing from 5.7% to 9.5% during that brutal credit squeeze.
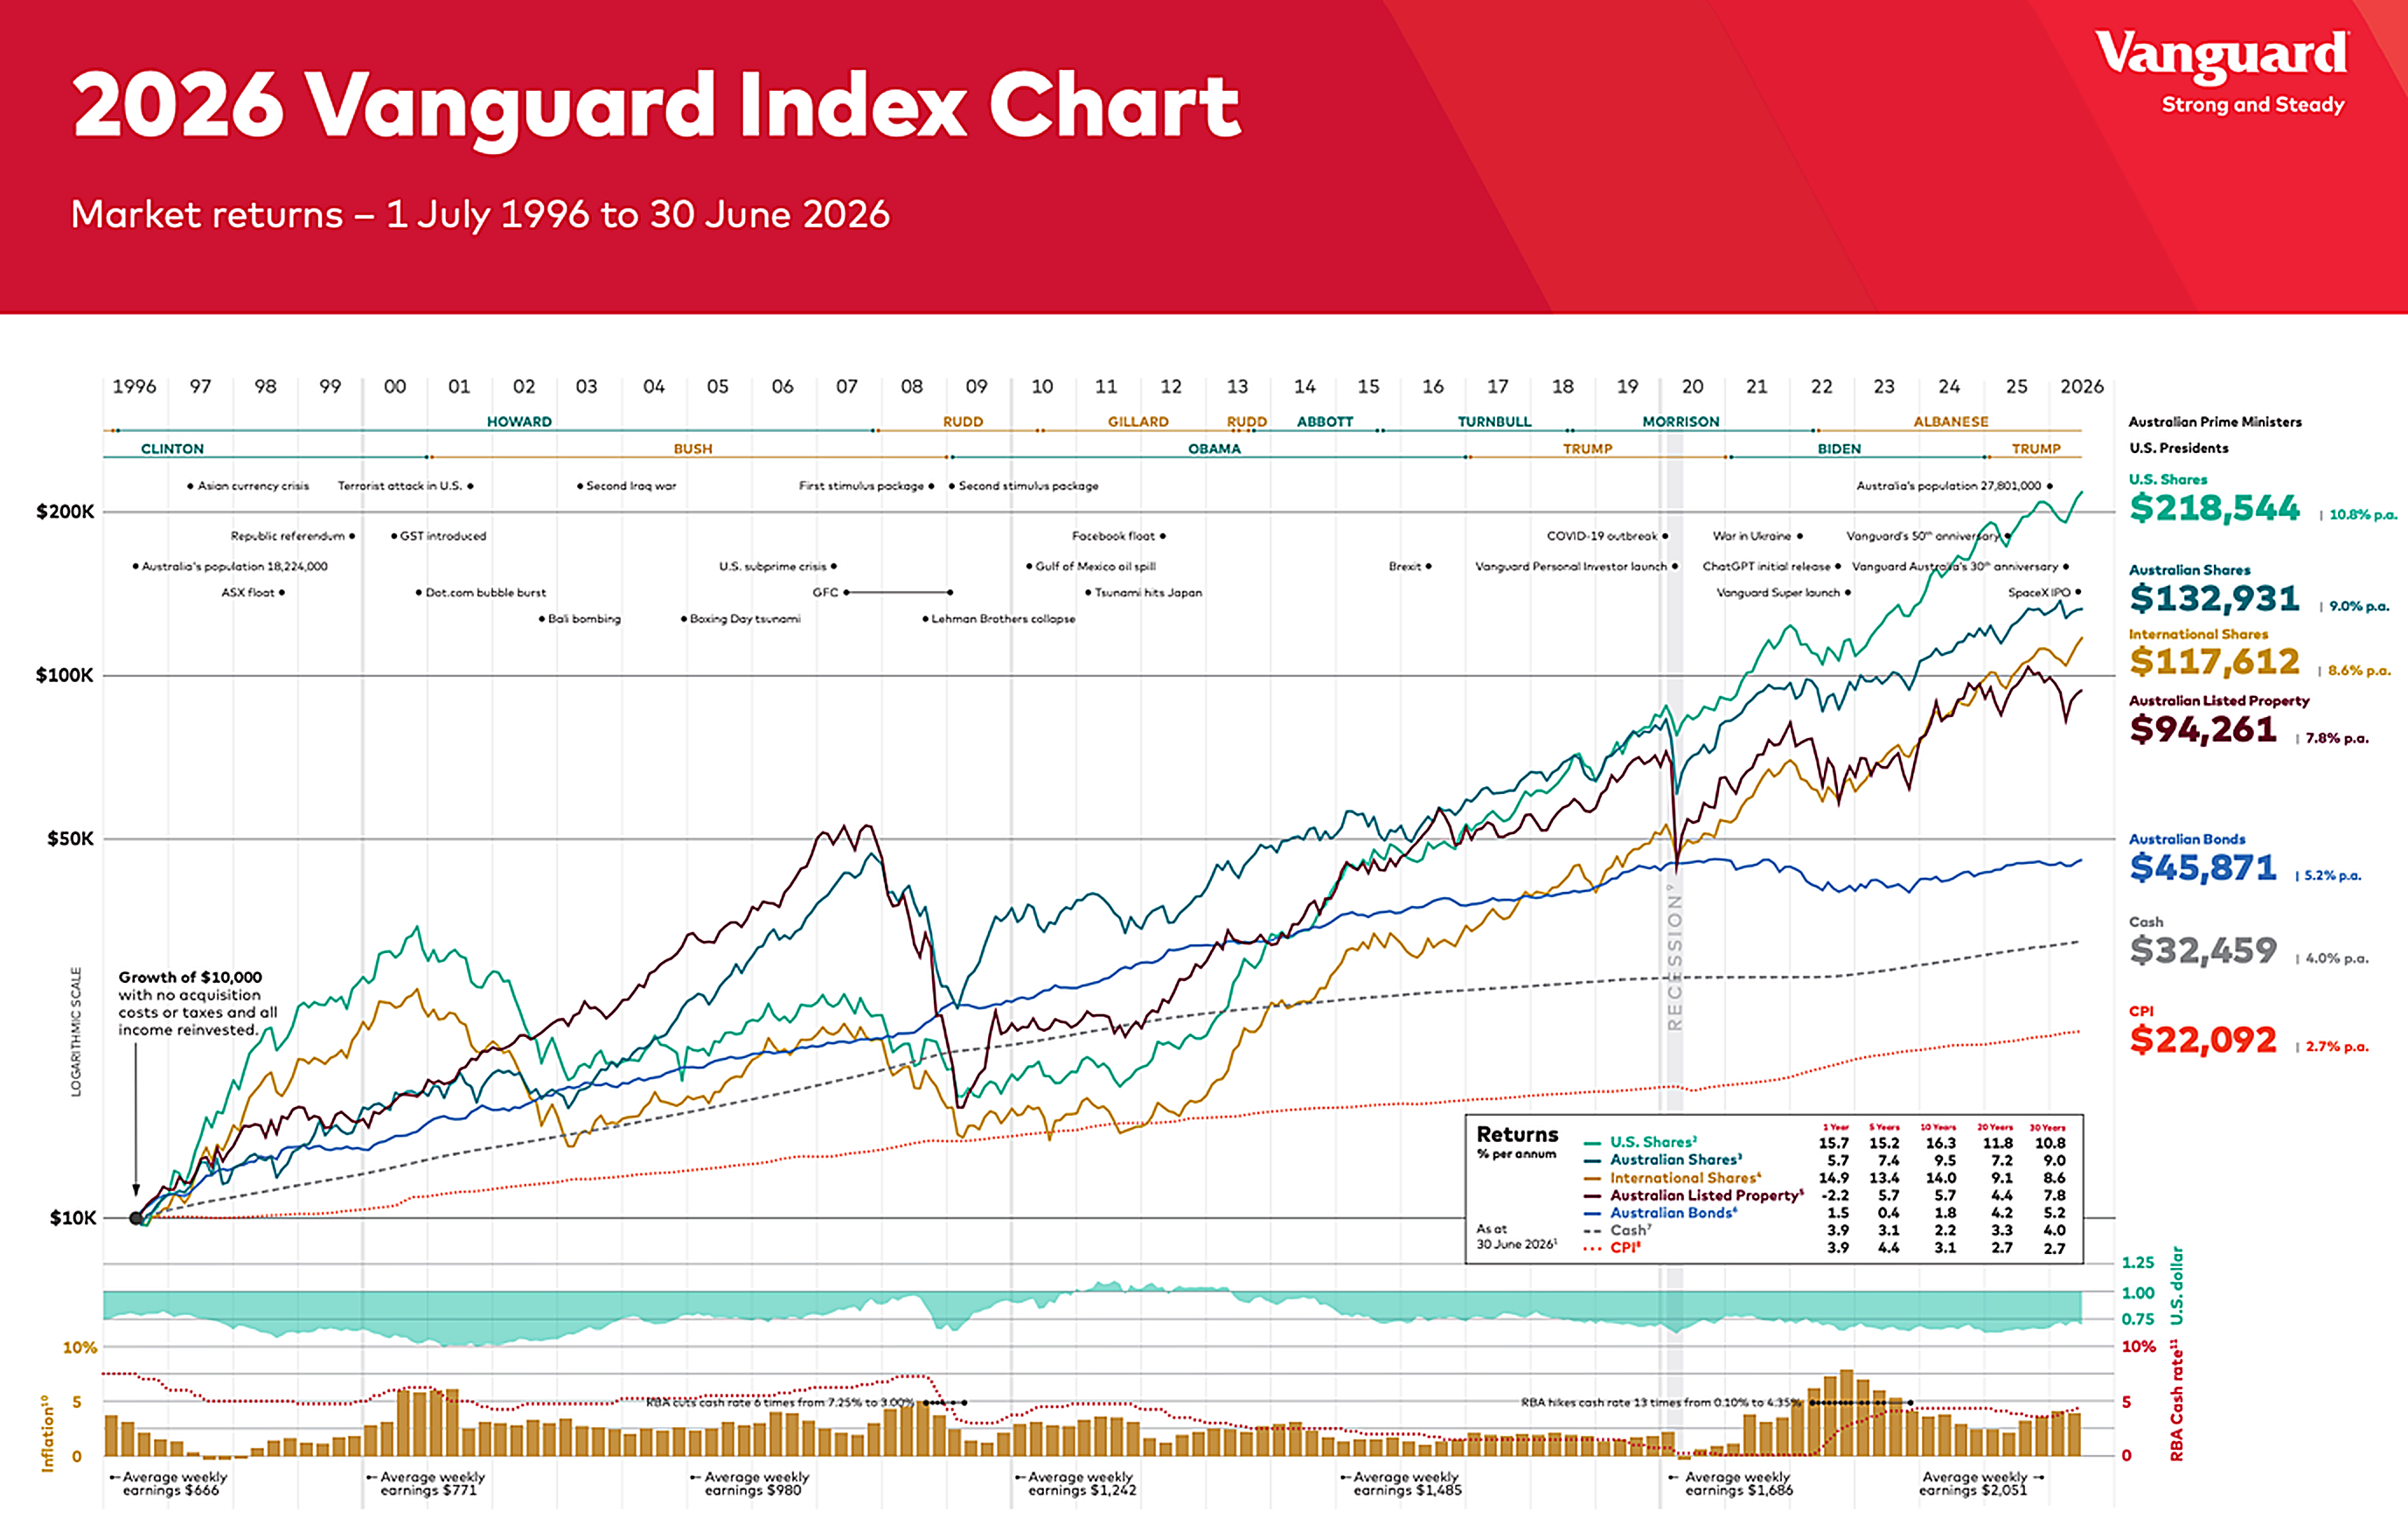
Source: Owen Analytics
US equities fared somewhat better, although their real returns were still negative. Large-cap US shares lost 1.4% p.a. after inflation through the 1970s, even though company profits grew 9% p.a. in nominal terms.
That’s the stagflation trap: earnings rise on paper while valuations shrink.
The Assets That Preserved Real Wealth in Inflationary Periods
That historical episode points to four asset classes or strategies that work best when inflation surges and economic growth suffers:
1. Commodities
Commodities were a standout performer during the 1970s, and across all eight US inflation surges studied by Man Group they delivered positive real returns, averaging 14% p.a. after inflation, although the results varied widely between individual commodities.
Gold was the strongest of them in the 1970s.
2. Trend-Following Strategies
The surprise winning strategy was trend-following, the approach (now offered through managed funds) that systematically buys rising assets and sells falling ones.
In Man Group’s study, which relies partly on simulated historical returns, it delivered average real returns of 25% p.a. across the eight inflation surges.
The explanation is intuitive: inflation shocks create persistent trends, with shares and bonds falling and commodities rising for prolonged periods.
It’s worth bearing in mind that these strategies can struggle in choppy markets, and the fees are often on the high side.
3. Inflation-Linked and Shorter-Duration Bonds
Nominal bond returns deteriorated in the 1970s as yields rose, with longer-duration bonds (those most sensitive to rising interest rates) hit hardest.
Inflation-protected government bonds did not exist in the major markets at the time (the UK first issued them in 1981, Australia in 1985 and the US in 1997), but they are designed for exactly this risk and, on the limited data available, have held up better than conventional bonds.
Australian options include inflation-linked government bonds, shorter-dated bonds that can be reinvested sooner at higher rates, and floating-rate exposures whose income resets as rates rise.
4. Quality Companies
One of the more chilling lessons from Man Group’s research was that no equity sector offered reliable protection.
Even energy was only slightly better than flat in real terms.
However, quality global strategies favouring profitable, strongly capitalised companies provided some protection.
Prepare for Stagflation, But Don’t Bet on It
Nobody knows whether the remaining months of 2026 will bring a return to lower oil prices or a more stubborn inflation environment marked by rising oil prices and interest rates.
The historical evidence argues against an all-in bet on gold or energy. Instead, it favours portfolios that can cope with either outcome. Real returns are the name of the game, with a focus on assets that can outperform in a weaker economic environment. That means deliberately sized exposure to the assets that have historically held their value in the face of stagflation, namely commodities, trend-following strategies, inflation-linked bonds and quality strategies focused on harnessing pricing power.
It also means staying invested. Many of the worst 1970s outcomes belonged to the most pessimistic investors who sold near the 1974 low. Pessimism is rarely a sound basis for successful long-term investment decisions.
Frequently Asked Questions
What Is Stagflation?
Stagflation is high inflation combined with weak growth and rising unemployment. It is hard to fix because raising rates can deepen the slowdown, while cutting them can entrench inflation.
Which Asset Classes Perform Best During Inflation Surges?
Research covering eight US inflation surges found commodities and trend-following delivered positive real returns in every episode, while shares, nominal bonds and 60/40 portfolios lost value after inflation on average.
Are Bonds a Good Hedge Against Stagflation?
Conventional fixed-rate bonds have historically been a poor hedge, with longer-dated bonds hit hardest as yields rise. Inflation-linked and shorter-duration bonds have been more resilient.
Is Gold Still a Stagflation Hedge at Today’s Prices?
Gold excelled in the 1970s, but it has been volatile in 2026. It can diversify a portfolio, though its price already reflects some of the risks investors fear.
How Is 2026 Different from 1973?
Economies use far less oil per dollar of output, inflation is starting from a much lower level, and central banks are independent with explicit targets. The key similarity is an oil supply shock arriving while inflation, and consumers’ expectations of it, are already elevated.
Author

Simon Turner
Head of Content (CFA), InvestmentMarkets
Related Articles
-bdbiwz8205nswwsyamvg.png)
-omzb66raxn0qmnnqtg60.png)
Investments You May Like

Global X S&P World ex Australia GARP ETF (ASX: GARP)
GARP provides access to global companies with strong earnings growth, solid financial strength, and trading at reasonable valuations.

JPMorgan Income Active ETF (Managed Fund) (Hedged) (Cboe: JPIE)
Designed to seek income and also capital appreciation by investing across debt markets.
Recent Articles
View all articles-c0r65slb5ciy1qtd4yd3.png)
-s5c0uf81il26meg3icyx.png)
-36ch97uhf8673866r770.png)