The growth of the Australian ETF market in only a decade is quite staggering. Standing at $370.8bn in funds under management today1, the market is nearly 16x larger compared to ten years ago and has averaged around 31% growth annually2. The market is widely tipped to hit $400bn by the end of 2026, after seeing record inflows in the first half of the year.
While the Australian market lagged global peers for many years, it has rapidly caught up and become popular with investors for the convenience, access and, depending on the selected product, lower costs. The rise of online trading platforms and surge in retail investors have supported the growth and demand for ETFs, with more options available than ever before.
With no sign of slowdown, where are Australians investing and where next for the market?
Prefer the designed PDF?
The 13-page guide has the charts and the full data appendix, laid out for print.
When it comes to popularity, equities dominate the game – particularly international equities, traditionally harder for Australian investors to access. Equities represent around 75% of the total funds under management in the ETF market, with the next biggest allocation of Australian fixed income only 9% of the total3.
Last year was a record breaker in terms of net flows, with all asset classes surpassing previous records. International equities received $20 bn in net flows, Australian equities received $13.2bn in net flows and fixed income received $11.6bn in flows. While some of the gains can be attributed to the growing demand for and popularity of the ETF market, it’s also worth highlighting that 2025 saw record-breaking performance in the US market and rising inflation in Australia increased the view that interest rates would increase in 2026 (and they did).
One of the most significant records to note came from the volume of flows received by gold ETFs — $1.8bn. Gold prices gained around 65% in 2025 off the back of rising geopolitical tension and increased central bank buying behaviour4. It was the second strongest year on record for global gold ETFs, according to the World Gold Council5.
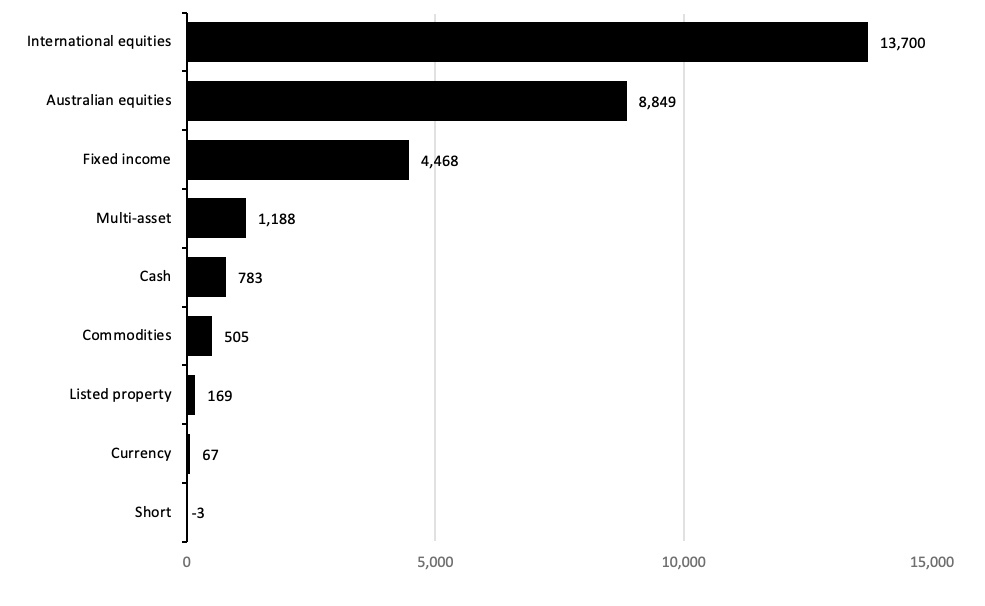
2026 is shaping up to be a similar year for flows across the first half of the year, with international equities continuing to dominate.
Asset class net flows H1 2026
Source: Betashares, ASX, CBOE, June 2026
Net Flows ($M)
International Equities
13,700
Australian Equities
8,849
Fixed Income
4,468
Mixed-asset
1,188
Cash
783
Commodities
505
Listed Property
169
Currency
67
Short
-3
There was a temporary reversal in flows to favour Australian equities over international equities in May. Some of the drivers behind this included geopolitical uncertainty, along with the changes to capital gains tax in the Federal Budget which saw investors shift their strategies towards income-generating investments, such as Australian franked dividend income.
These also saw flows towards Australian fixed income and cash ETFs more than double in June 2026 compared to April numbers as investors sought to bolster income-producing defensive assets as a means of navigating future market volatility.
Gold did lose some of its investor momentum in the first half of 2026 compared to last year. Some of this was to be expected, as gold markets experienced a price correction.
Passive still wins, despite the active launches
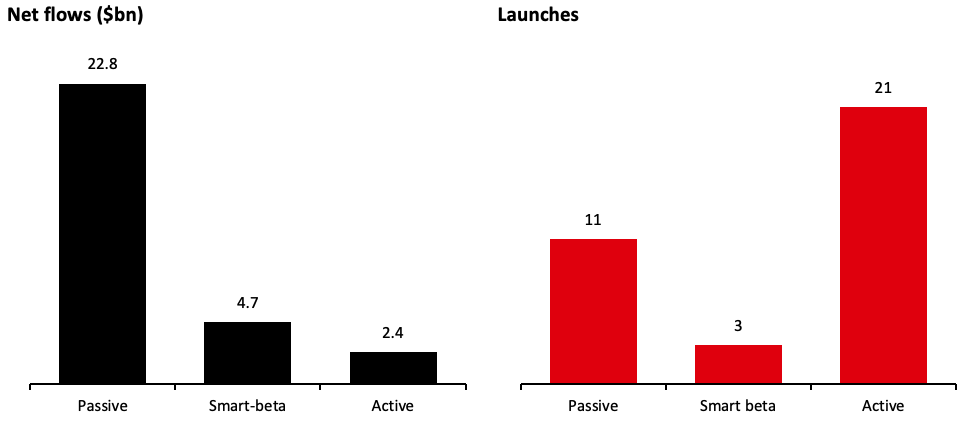
The first actively managed ETF on an Australian exchange was listed in 2015 and the volume of actively managed funds has continued to rise since then, even after a temporary ASIC moratorium on new active issues in 2019.
There are now 198 actively managed ETFs available on Australian exchanges, accounting for 20.1% of industry funds under management6, with as many as 17 new active issues in the June quarter of 2026.
Despite this, passive funds continue to heavily dominate flows, representing more than three-quarters of flows. It’s worth highlighting that thematic investments typically sit under passive investing, but broad-based index investments typically far outweigh the more niche thematic indices.
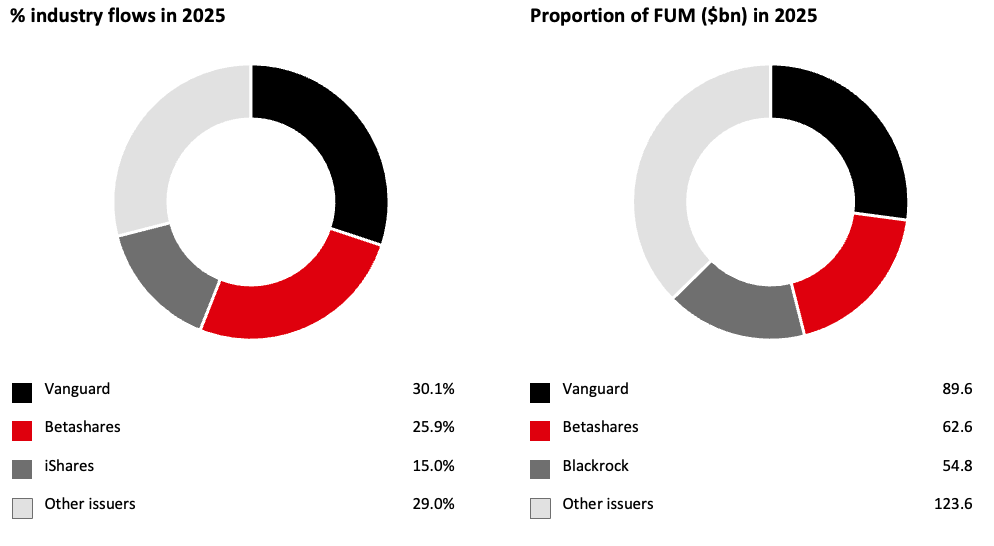
There are 65 issuers across the 457 ETFs listed in Australia, but investors shouldn’t assume the funds under management, or industry flows, are evenly spread.
Across 2025, three issuers dominated over 70% of industry flows and are responsible for around 60% of the funds under management.
You can see the top issuers below – other issuers account for 62 names.
This heavy concentration is something that investors should be conscious of for a range of reasons.
Firstly, if there are any issues with the market makers favoured by the three key providers, this could cause a liquidity problem across the broader market, meaning challenges for trading or valuation processing.
Secondly, it can be harder for smaller, niche issuers to build scale which means sustainability over the long term and the ability to lower costs. It can also result in more generic strategies if it is harder for niche offerings to attract the flows that larger issuers can garner, and increases the risk of eventual closure for smaller operators.
Launches, closures and the long tail
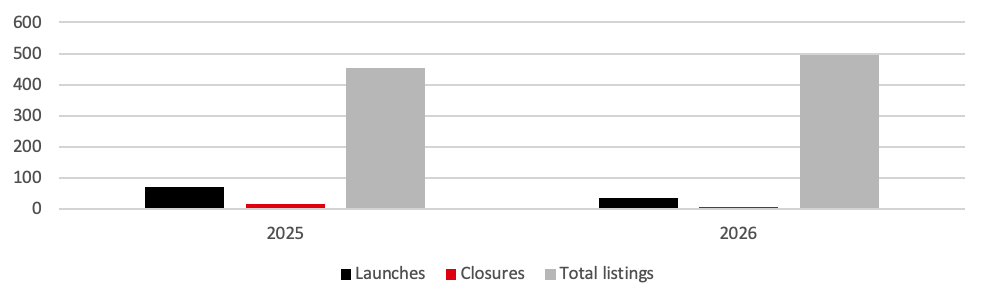
Last year was a record year for ETF launches, with 71 new listings and 15 fund closures. Listings have been strong this year too, with 35 new listings by mid-2026.
It’s worth noting that the total number of listings captures some dual listings for products on both the ASX and TMX Australia Exchange – this helps to explain the discrepancy between the number of new listings, closures and the total size of the market compared to six months ago.
Launches, closures and total market
Sources: Betashares Australian ETF Review 2025 recap, Global X ETF Market Scoops – January-June 2026.
2025
2026 (Through June 30)
Launches
71
35
Closures
15
7
Total Listings
453
496
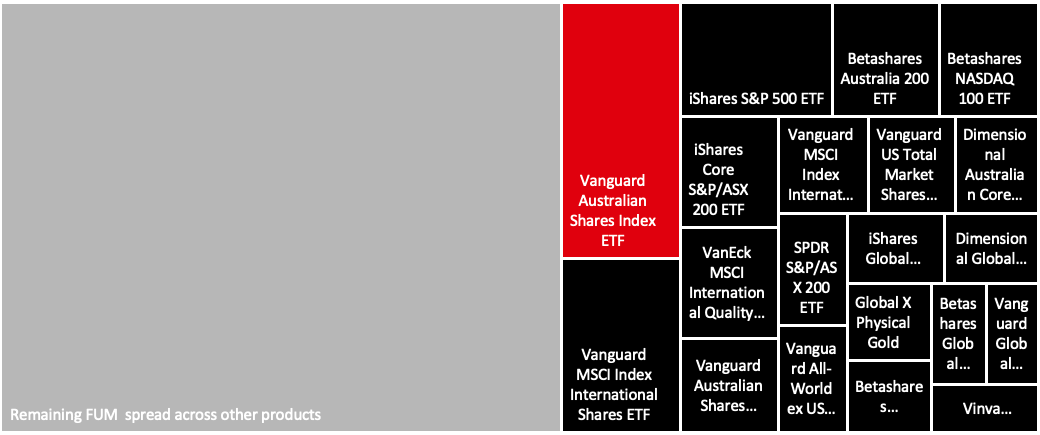
While there are hundreds of ETFs available to Australians, such is the popularity of the 20 largest ETFs that these represent 45.9% of the total funds under management in the Australian ETF market7. The largest fund, the Vanguard Australian Shares Index ETF (ASX: VAS), holds 6.8% of the total funds under management at $25.4bn8.
Vanguard MSCI Index International Shares (Hedged) ETF
7,297.24
Vanguard US Total Market Shares Index ETF
7,001.16
Dimensional Australian Core Equity Trust - Active ETF
6,744.07
SPDR S&P/ASX 200 ETF
6,491.30
Vanguard All-World ex US Shares Index ETF
6,176.57
iShares Global 100 ETF
5,724.47
Dimensional Australian Core Equity Trust (Unhedged Class) - Active ETF
5,532.07
Global X Physical Gold
5,368.01
Betashares Australian High Interest Cash ETF
5,038.48
Betashares Global Shares ETF
4,595.05
Vanguard Global Aggregate Bond Index (Hedged) ETF
4,424.07
Vinva Global Alpha Fund - Active ETF
4,340.86
Remaining FUM spread across other products
201,095.00
The newest 35 entrants to the market are merely a drop in the ocean – 0.62% of the total funds under management. On one hand, this isn’t surprising. It takes time to build up traction and assets. On the other hand, some entrants will never reach anywhere near the scale of the largest ETFs.
What are you actually holding?
More than 2 million Australians hold at least one ETF in their portfolio9, with some estimates suggesting that engaged investors may hold 5-10 ETFs with the aim of diversified exposure.
But are investors as diversified as they hope?
If you hold more than one Australian equities ETF, chances are you are concentrated to financials, particularly the big four banks, while if you hold broad global equities funds, you may be surprised to realise these are dominated by the Magnificent Seven stocks.
Just look at the indices.
Many Australian investors will use a broad-based S&P/ASX exposure and then add in something more tailored, like a dividend focus. This can end up leaving you over-exposed not just to the financials sector but also to the same four stocks in particular.
For example, the S&P/ASX 200 is weighted 34% towards financials and 23.6% of allocation is to the big four banks: Commonwealth Bank, Westpac, NAB and ANZ10. The FTSE Australia High Dividend Yield Index has a 39.8% weighting towards financials and 29.16% of the allocation is specifically to the big four banks11.
Or alternatively, investors often combine a broad global index, like the MSCI World Index ex Australia, with a US-specific index like the Nasdaq 100.
You might be shocked to realise that approximately 24% of the MSCI World Index ex Australia is specifically the Magnificent Seven stocks and US stocks represent more than 70% of the allocation. The Magnificent Seven represent 34.7% of the Nasdaq 100 Index. You are heavily exposed to just seven tech stocks and their fortunes rather than the broad global exposure you may have thought you were getting.
Imagine if you were then to add a thematic or sector-specific ETF for an extra tilt to tech. You’d simply be gaining exposure to the same stocks again.
Investors also hope to achieve better diversification by adding currency-hedged and unhedged versions of the same index. They hold the same stocks. The difference is simply that the hedged version will also incorporate currency derivatives to minimise the impact of currency changes on the value of the portfolio. If you are concerned about currency, pick the hedged option. If not, stick with the unhedged version, otherwise you are simply cancelling out the hedging and doubling up on stocks.
So how can you work out what you are investing in and whether you are overly concentrated?
Head to the issuer websites for each of your chosen ETFs. On the page for your selected ETF, you’ll be able to download a spreadsheet of the complete holdings of the ETF daily and it notes the allocation weights. You can also sort these by weight to see which are the biggest holdings.
Map your own unit holdings against each of these and then you can combine them.
From here, you’ll get an overall picture of how concentrated, or how diversified, your portfolio might actually be.
G8 – Portfolio overlap look-through
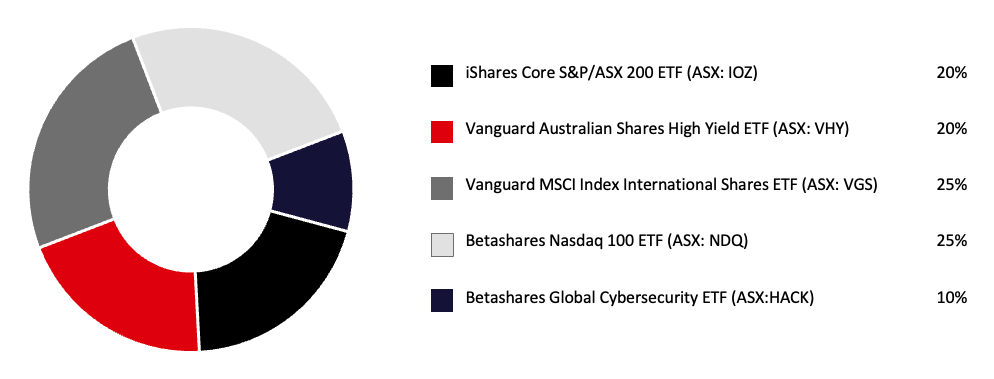
The below example considers the crossover in a portfolio made up of some of the most popular and largest ETFs in Australia, covering broad-based Australian and global indices, Australian dividends, US equities and a thematic investment. It uses a standard weighting of 40% to Australian equities, 50% to global equities and 10% to the thematic investment.
Portfolio composition
Allocation
iShares Core S&P/ASX 200 ETF (ASX: IOZ)
20%
Vanguard Australian Shares High Yield ETF (ASX: VHY)
20%
Vanguard MSCI Index International Shares ETF (ASX: VGS)
25%
Betashares Nasdaq 100 ETF (ASX: NDQ)
25%
Betashares Global Cybersecurity ETF (ASX:HACK)
10%
What this actually translates to when you go through the holdings is that the top allocations in your portfolio are actually dominated by Australian financials and US technology firms. These top 15 companies represent around 36% of your total portfolio based on the current underlying allocations in each of the ETFs you’ve selected.
Holding Name
Ticker
Sector
Country code
% of net assets
BHP Group
BHP
Industrials/Materials
AU
4.224976
Commonwealth Bank
CBA
Financials
AU
4.055666
Nvidia
NVDA
Technology
US
3.417435
Apple
AAPL
Technology
US
3.08551
Alphabet
GOOGL
Technology
US
2.75
Microsoft
MSFT
Technology
US
2.540632
Westpac
WBC
Financials
AU
2.182522
National Australia Bank
NAB
Financials
AU
2.166544
ANZ Group
ANZ
Financials
AU
1.9751
Amazon
AMZN
Consumer discretionary
US
1.848737
Broadcom
AVGO
Technology
US
1.833416
Macquarie Group
MQG
Financials
AU
1.560246
Rio Tinto
RIO
Industrials/Materials
AU
1.533918
Woodside
WDS
Energy
AU
1.52565
Micron Technology
MU
Technology
US
1.42607
If you look specifically at the top 20 holdings for each, there is crossover for 14 out of the top 20 names in the Australian equities and 12 out of the top 20 names in the global equities and US equities options (if you combine the two Alphabet listings).
When it comes to the cybersecurity ETF, there are two names that cross over with both the other international equity ETFs, and four that cross over specifically with the Nasdaq 100's top 20 holdings.
Ten things to check before you buy your next ETF
1. What does the ETF actually hold?
Look beyond the name of the ETF to the actual holdings. You can download the full holdings from the issuer website.
2. What does it overlap with?
Compare the holdings to the holdings in the ETFs you already own. You can start with a quick scan of the top 10-20 stocks. Consider what this would mean for real allocations in your portfolio when combined.
3. What is the total cost?
It’s easy to get caught up in the marketed headline costs, but take the time to consider the total cost ratio, plus the trading costs and applicable taxes so you can see the full picture. Remember ETFs have a buy-sell spread, meaning there is a price to buy units, compared to selling.
4. How big is the fund?
The bigger the fund, the better the liquidity if you need to sell units. It also reduces the risk of closure. Smaller funds may struggle to fund the costs of operation; the rule of thumb is generally above $50 million in funds under management for a fund to start to be profitable12.
5. How tightly does it trade?
Have a look at average daily volumes and the buy-sell spread. These are available on issuer websites and you can also find these in the ASX monthly investment product updates. You want to see a small gap between the buy and sell prices and high average daily volumes of trading because this indicates high liquidity and better trading costs as you would lose less money buying or selling units.
6. Is it physically backed or synthetic?
A physically backed ETF holds the actual assets, such as company shares, whereas a synthetic ETF will hold derivatives, such as options and managed futures, to replicate performance of the actual assets. Using derivatives can bring counterparty risk into play, where one party fails to meet the agreed contract terms. You should be aware of that risk before investing.
7. Is it hedged, and did you choose that?
Some ETFs include hedging, others don’t. It is an active position to manage foreign currency and can change the performance of your ETF and include higher management fees. Whether you intend this or not, hedging is typically used when you anticipate your domestic currency to appreciate against foreign currencies and hope to protect the value of your investment. It tends to be more a short-term view as currencies do typically fluctuate over the longer term.
8. What index does it track, and how well?
Look through the ETF documentation to see what index it tracks and whether this is a standard broad-based index, like the S&P/ASX 200 or a bespoke index, such as one following a particular theme. Then look at the tracking error to check that it is actually following the strategy it claims to – a bigger difference suggests it is failing to match the index (unless it is a deliberate active strategy), while a smaller difference suggests it is doing what it needs to.
9. How is it taxed and distributed?
Depending on the assets and distributions an ETF makes, you may find different tax outcomes. Distributions from an ETF using options for example, or other trading strategies, may be treated under capital gains tax rules. By contrast, distributions from an ETF that are based on dividend income or interest payments from bonds are treated as part of your annual income and taxed at your marginal tax rate. Some Australian equity ETFs will also distribute franking credits to be used as part of your tax return.
Depending on the structure of an international ETF, there may be tax implications relevant to where the assets are held and you may need to declare foreign income on your tax statement. If distributions are part of your investment strategy, make sure to check how frequently the ETF pays these so you can factor this as part of your plan.
10. How long has it existed?
Generally, investors are encouraged to look for long track records where they can see performance over multiple cycles and evidence of how the management team has adhered to their stated strategy. While it’s not necessarily a red flag if an ETF has only been recently listed, you may want to do further due diligence on the issuer of the ETF as well as the strategy itself to ensure it will be sustainable and not close, as well as perform in line with its objectives.
Disclaimer: This article is prepared by Sara Allen. It is for educational purposes only. While all reasonable care has been taken by the author in the preparation of this information, the author and InvestmentMarkets (Aust) Pty. Ltd. as publisher take no responsibility for any actions taken based on information contained herein or for any errors or omissions within it. Interested parties should seek independent professional advice prior to acting on any information presented. Please note past performance is not a reliable indicator of future performance.
A passionate writer and reader across finance (primarily investments and superannuation), lifestyle, literature and travel. I have more than fifteen years' experience in content and marketing covering writing, editing, strategy development and execution, budgeting, events coordination, project management, web content management, seo and social media channels and stakeholder management across all levels.
AI advice platforms sit inside the same ASIC rules as human advisers. What Otivo, Stockspot and moneyGPS cover, charge and won't touch, and what to check.
Most of us have seen ourselves as stock pickers extraordinaire at some point in our investing journeys. The idea of investing in stocks is exciting, seductive even. After all, all you need to do is press buy and sell online and you could make yourself a fortune.




-drhkgsdwk8x3oqxim0go.png)
-uo4eg7ge0ysewqkveu92.png)
-qn47nb2t9h7iuvyq9ohf.png)