
China’s Record Slump: Opportunity or Value Trap?
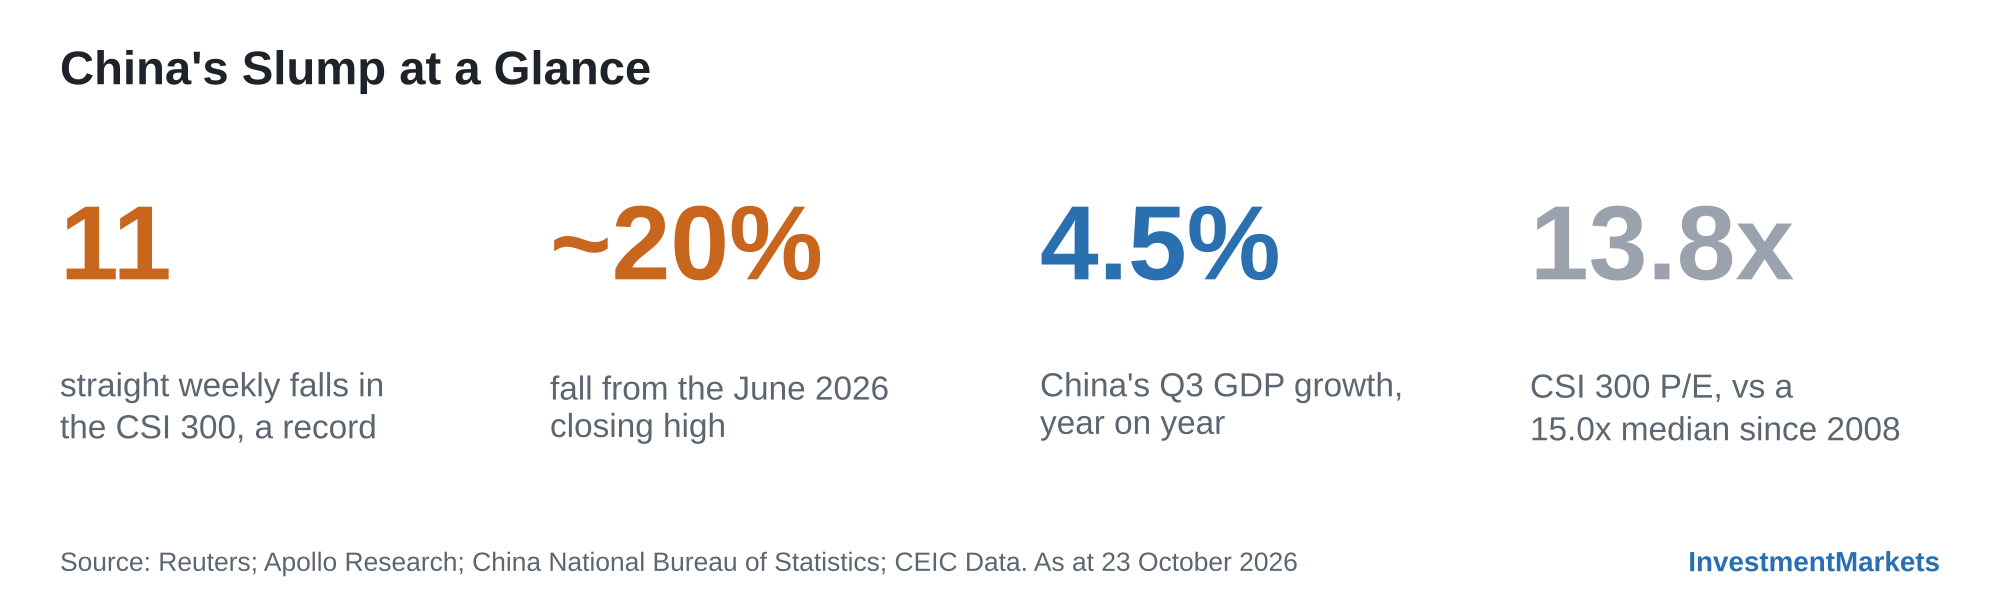
China’s blue-chip CSI 300 index recently suffered its longest losing streak since the index was created in 2005, falling for 11 consecutive weeks. The previous record was eight weeks, a run it recorded twice in 2008 and again in 2011–12. Along the way, the index briefly fell more than 20% from its June peak, tipping it into a bear market. It’s been costly. Chinese equities have lost US$3.5 trillion in value since May.
Yet the Chinese economy grew 4.5% year on year in the third quarter, beating forecasts and picking up from 4.3% in the second quarter.
For investors, the gap between a growing economy and a falling market raises the question every contrarian asks: is this a buying opportunity, or the start of a longer-term bear market?
The answer affects Australian investors on several fronts. China sits inside many global ETFs and emerging markets ETFs, and it also plays a major, albeit less visible, role inside the ASX through iron ore, the miners and the Australian dollar.
Source: Business Recorder, Apollo Research, CEIC Data
Key Takeaways
- The CSI 300 has fallen for a record 11 straight weeks and briefly dropped more than 20% from its June peak, led by the very AI and semiconductor stocks that drove the first-half rally.
- Earnings, not GDP, are the problem: third-quarter earnings missed already-lowered forecasts.
- State-backed buying tends to soften the falls but has not historically created lasting bull markets on its own.
- Valuations are below their long-run median but not at crisis lows, so earnings need to stabilise before the Chinese investment case becomes compelling.
- Many Australian investors already carry large indirect China exposure through resources and the Australian dollar, which should be considered during any decision to add more.
Why the Chinese Sell-Off?
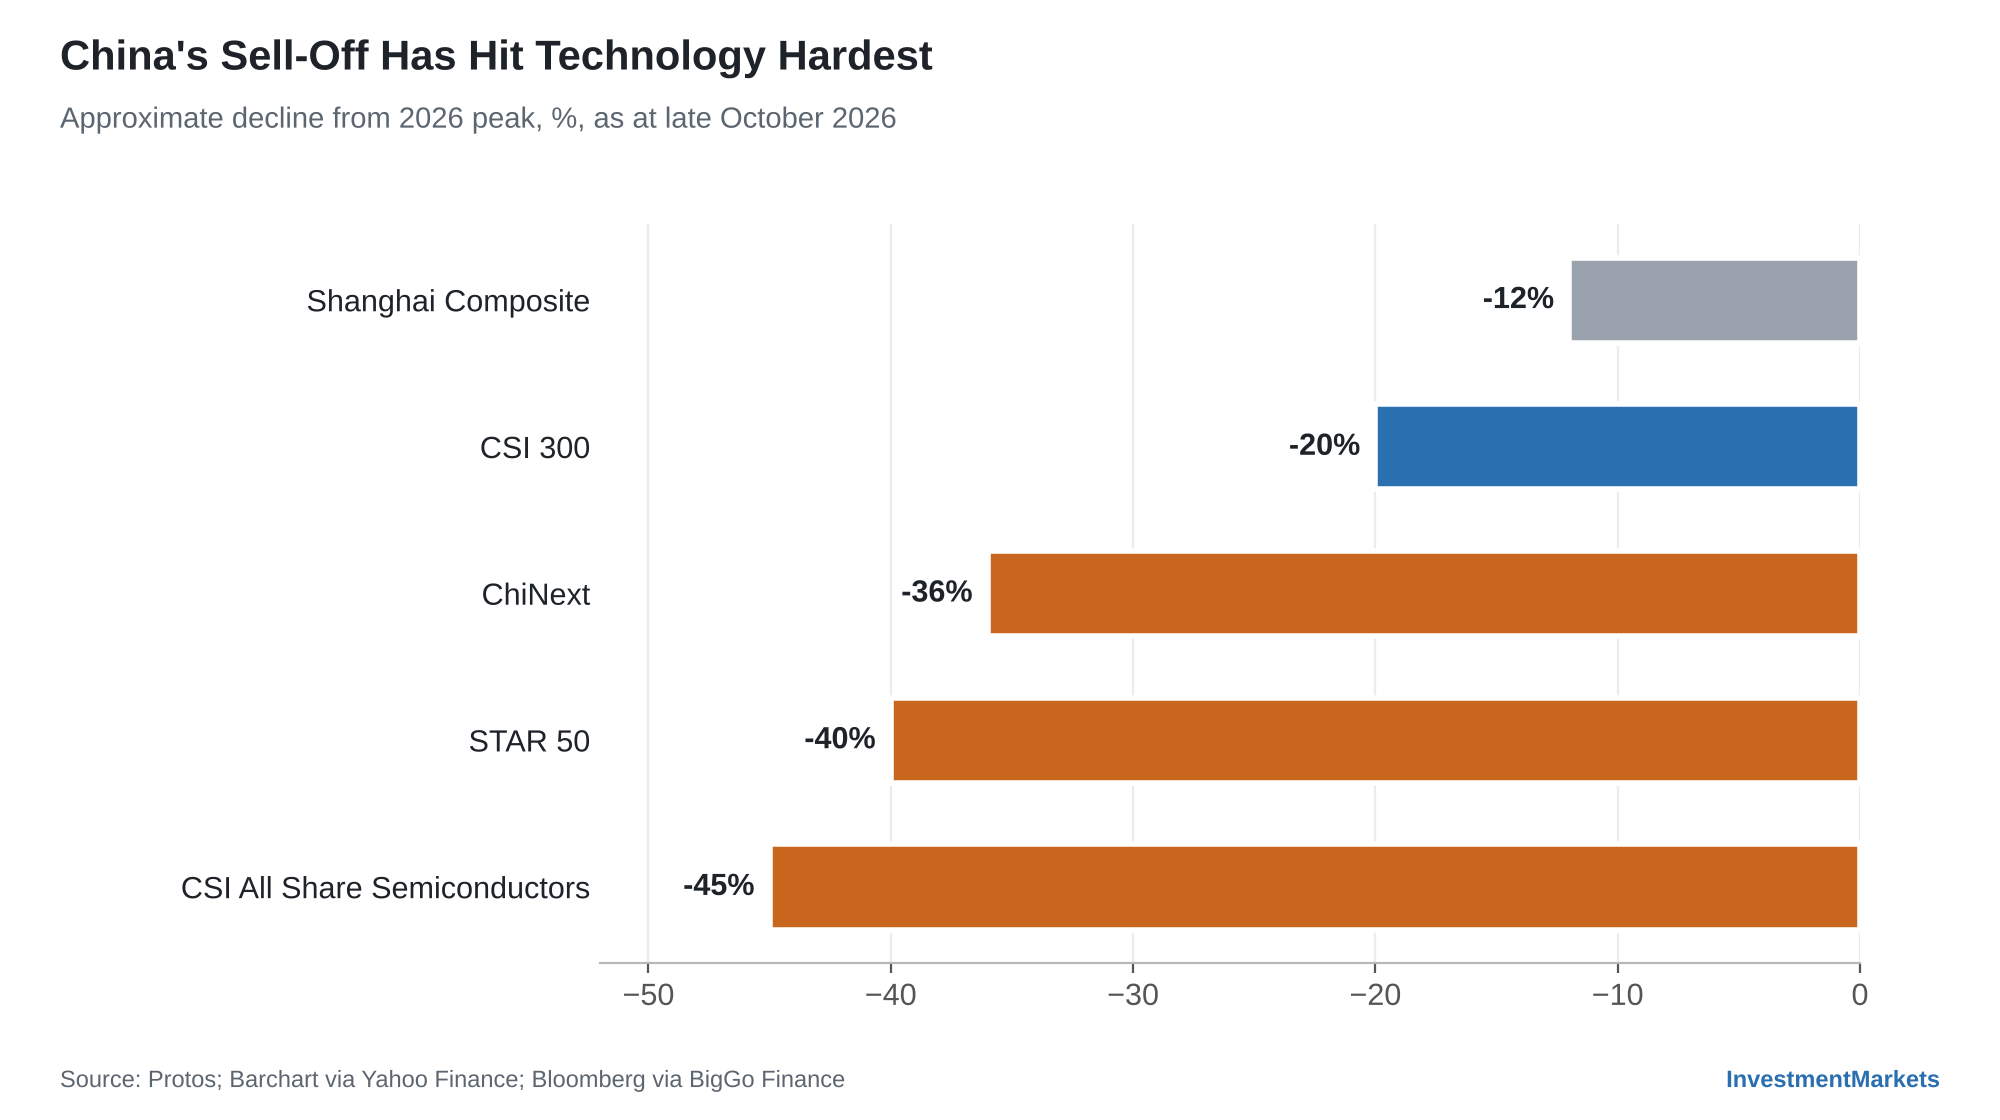
The China sell-off has been broad-based, with the tech sector leading the way down.

Source: Business Recorder, Apollo Research
China’s STAR 50 index, heavily weighted to a handful of AI companies, fell 40% since 30 June, while the CSI All Share Semiconductors index fell 45%. Chipmakers MetaX and Moore Threads, the stars of last year’s listings boom, each lost about half their value during the sell-off.
Source: Protos, Yahoo Finance, BigGo Finance
The recent earnings season only added to investors’ worries.
Battery giant CATL grew third-quarter revenue by 58.6% but attributable profit by only 14.5%. Its Hong Kong shares plummeted 19% in a week.
That has implications closer to home.
As the world’s largest battery maker, CATL is a bellwether for battery-material demand, so its margin squeeze is a warning sign for ASX-listed lithium producers such as IGO, Liontown and Mineral Resources. Chinese lithium major Ganfeng Lithium also missed estimates this season on falling prices.
The reporting season challenges were widespread.
MSCI China members that have reported so far missed consensus earnings forecasts by an average of 9%, even after full-year estimates were cut by more than 4% since the end of March.
In short, Chinese fundamentals have significantly deteriorated in recent months.
Explore 100's of investment opportunities and find your next hidden gem!
Search and compare a purposely broad range of investments and connect directly with product issuers.
Why China’s Economy Is Growing While Its Stock Market Falls
Stock prices generally follow earnings rather than economic output, although a booming economy usually provides the conditions for strong earnings growth.
China’s 4.5% growth during the third quarter was driven largely by exports of high-tech hardware into the global AI build-out, while domestic demand remained weak and widespread price wars compressed margins in many industries.
This solid economic growth reduced Beijing’s urgency to deliver the kind of stimulus that had ignited rallies in the past.
As RBC Wealth Management noted, Beijing is favouring small, incremental steps over the kind of large-scale packages it unveiled in 2024.
This is a familiar lesson for anyone who has invested in China over the past two decades. Strong headline growth has repeatedly failed to translate into shareholder returns when it comes with overcapacity, thin margins and state priorities that put national goals ahead of minority investors.
The State Is Buying, But It Is Not a Floor
State-backed funds appear to have stepped up their buying of domestic equities, judging by heavy trading in the ETFs they favour, although Beijing has not officially confirmed the purchases.
While this is welcome, history suggests state buying of this nature dampens declines rather than reversing them. In contrast, sharp rebounds have tended to follow genuine policy shocks.
In September 2024, the CSI 300 jumped 15.7% in a single week after Beijing unveiled its stimulus blitz, its best week since 2008. That rally ultimately carried the index above 5,000 by June this year, before the current slide gave back much of the gain.

The key takeaway is that Chinese rallies tend to arrive without warning. Investors who wait for clear evidence that a recovery is underway usually miss the first, sharpest leg. Equally, those who buy early tend to weather further losses first.
Are Chinese Equities Cheap Enough?
We aren’t yet at bargain-basement levels.
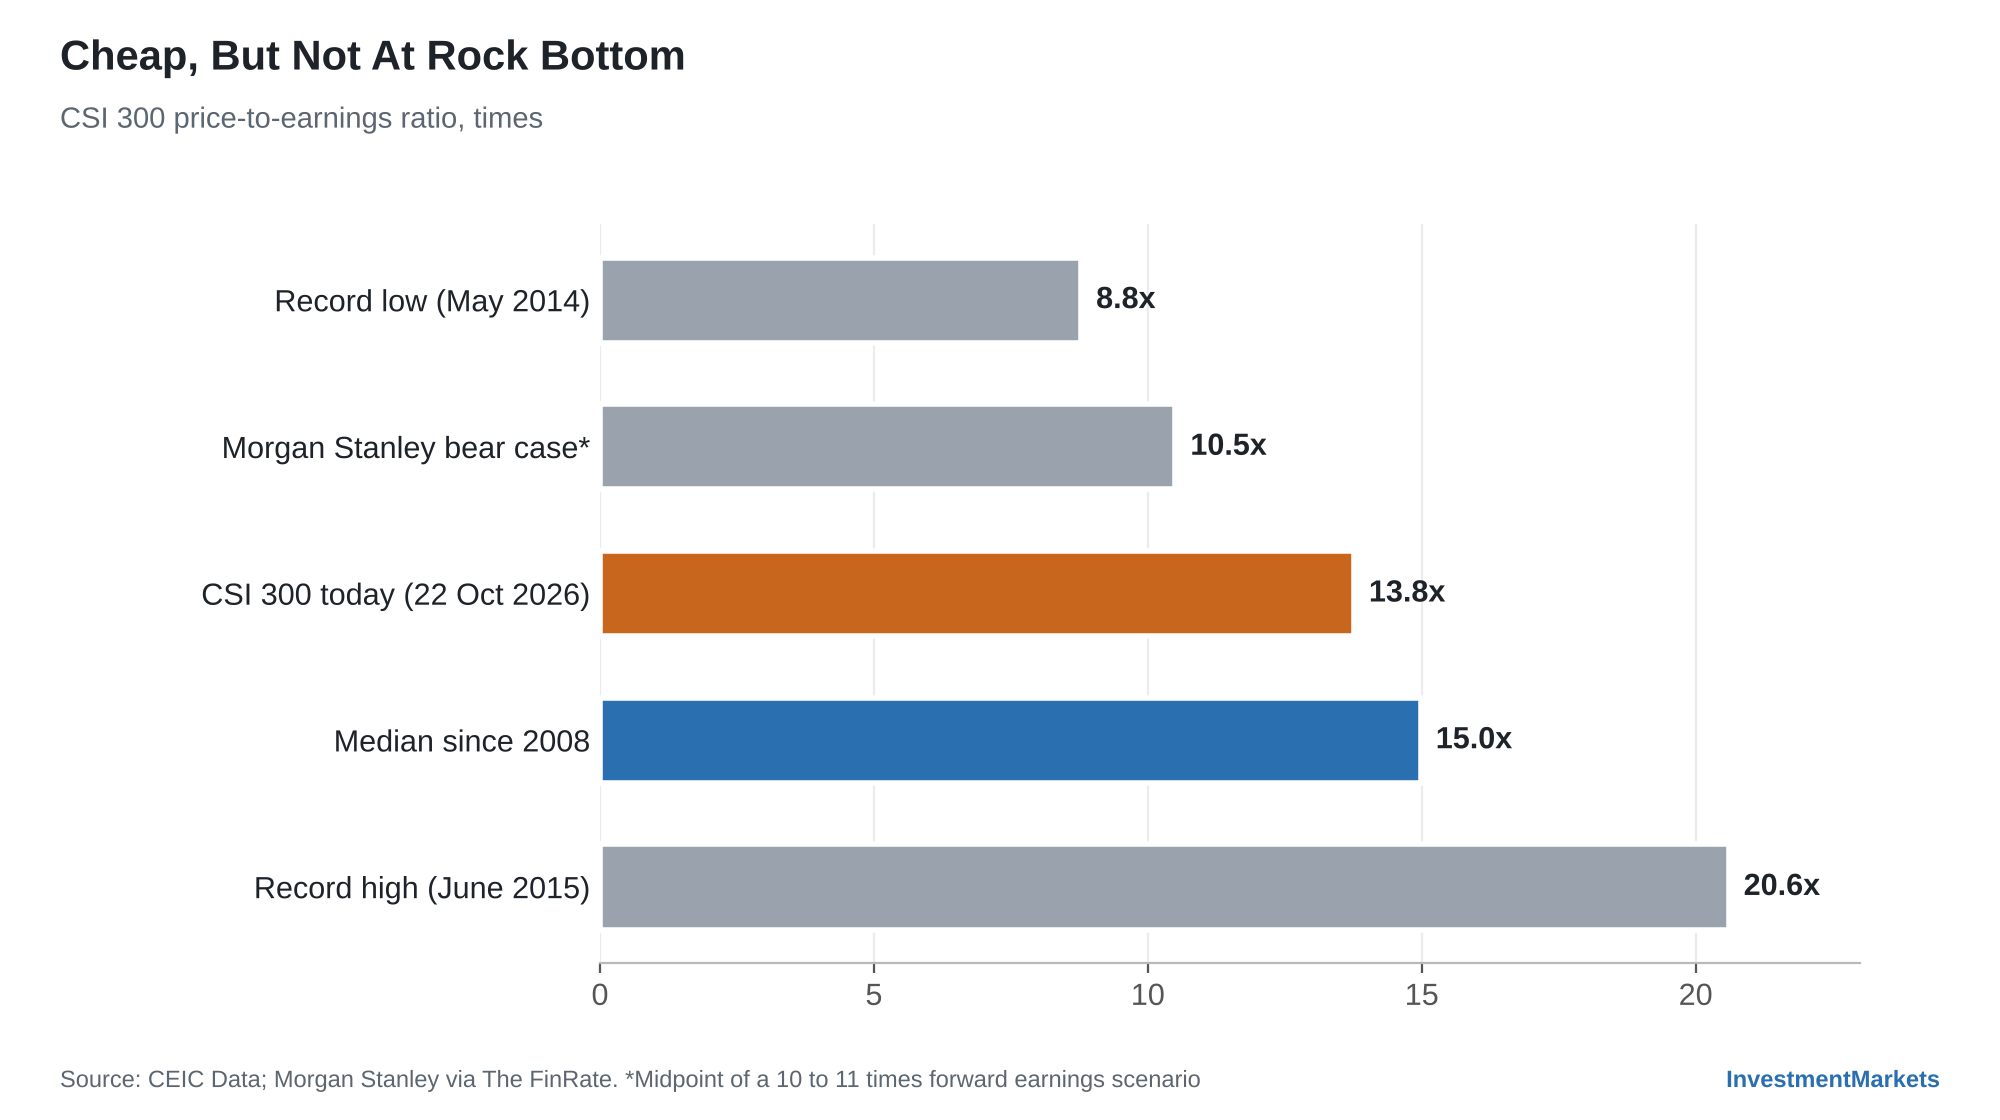
The CSI 300 trades on a price-to-earnings ratio of 13.8 times, below its median of 15.0 times since 2008 but well above its 2014 low of 8.8 times, CEIC data show.
Morgan Stanley remains cautious. It cut its mid-2027 CSI 300 target to 4,880 back in September, before the worst of the slide, and now warns that offshore Chinese stocks listed in Hong Kong and New York could fall another 10% to 15%. It also sees mainland shares potentially de-rating to 10 to 11 times forward earnings.
Source: CEIC Data, The FinRate
On a more positive note, Bridgewater’s Chinese arm has turned ‘prudently optimistic’, arguing that the third-quarter sell-off was largely a liquidity event and that valuations are not stretched.
Both views could be correct. A market can be reasonably cheap and still fall further if earnings estimates keep sliding.

Source: The FinRate, Business Recorder, The Edge Malaysia
Investment Implications
We see three main investment implications:
You May Already Own More China Than You Think
China is one of Australia’s largest trading partners, particularly for resources and materials.
The country buys almost a third of Australia’s exports (about 29% in 2025), and it received 84% of Australian iron ore shipments in the first seven months of 2026.
Hence, an investor heavy in Australian ETFs or mining and resources funds is already making a sizeable China bet and, through the Australian dollar, which tends to move with it, a currency bet too.

Source: ABS, Hellenic Shipping News
Currency matters as well.
An unhedged China ETF gives you two exposures: Chinese share prices and the exchange rate between the Australian dollar and the yuan. The yuan has held up well, sitting near a four-year high against the US dollar, which has softened some of the losses for foreign investors.
How to Adjust Your China Exposure
The broadest route into Chinese equities is a diversified emerging markets ETF such as the iShares MSCI Emerging Markets ETF (IEM), where China makes up roughly a quarter of the fund alongside many other markets.
Regional options include the index-tracking Vanguard FTSE Asia ex Japan Shares ETF (VAE) and the actively managed Platinum Asia ETF (PAXX), alongside managed emerging markets equity funds.
Dedicated China exposure is narrower: the iShares China Large-Cap ETF (IZZ) holds Hong Kong-listed giants, while the VanEck FTSE China A50 ETF (CETF) holds the mainland A-shares at the centre of this streak.
Investors who want less China, not more, can use an ex-China fund such as the iShares MSCI Emerging Markets ex China ETF (EMXC).

Source: Issuer websites, Pearler, ReviewETF
Don’t Ignore the China-Specific Risks
There are a number of risks worth being aware of that are specific to China:
- Chinese policy risk cuts both ways, and may be negative for equities.
- The main offshore Chinese indices, such as MSCI China and the Hang Seng, tend to be concentrated in a few internet and technology names, while the CSI 300 is spread more broadly across financials, industrials and consumer stocks.
- An A-share fund and a Hong Kong large-cap fund can behave very differently in the same week.
Subscribe to InvestmentMarkets for weekly investment insights and opportunities and get content like this straight into your inbox.
Cautious Optimism on China
The evidence says China’s main challenge right now is earnings growth. On a more positive note, state buying can soften the falls, and valuations are below their long-run median, although not yet at bargain levels.
On balance, China appears to be a solid candidate for patient, measured exposure rather than a bold all-in bet.
The prudent starting point is to gauge your existing Chinese exposure via the resources sector and the Australian dollar, decide whether more is warranted, and then build your exposure gradually, accepting that the timing of the turn is unknowable.
Investors who want to go further can compare options across emerging markets ETFs.
Frequently Asked Questions
Why Are Chinese Stocks Falling in 2026?
Mainly because corporate profits are disappointing. AI and semiconductor stocks that led the first-half rally have fallen 40% or more, third-quarter results have missed forecasts and Beijing has opted for small policy steps rather than large stimulus.
What Is the CSI 300 Index?
The CSI 300 tracks the 300 largest and most liquid A-shares listed in Shanghai and Shenzhen. It is the main benchmark for mainland Chinese equities and is the index most often bought by state-backed funds during sell-offs.
Do Australian Global ETFs Hold Chinese Shares?
Developed-market global ETFs usually hold little or no China, while all-world and emerging markets ETFs hold meaningful amounts. Checking a fund’s index and country weights is the quickest way to see your exposure.
Is a Long Losing Streak a Buy Signal?
Not on its own. Streaks reflect sentiment, and sentiment can stay negative long after the selling looks overdone. Valuation, earnings revisions and policy direction are more useful guides than the number of red weeks.
Disclaimer: This article is prepared by Simon Turner. It is for educational purposes only. While all reasonable care has been taken by the author in the preparation of this information, the author and InvestmentMarkets (Aust) Pty. Ltd. as publisher take no responsibility for any actions taken based on information contained herein or for any errors or omissions within it. Interested parties should seek independent professional advice prior to acting on any information presented. Please note past performance is not a reliable indicator of future performance.
Author

Simon Turner
Head of Content (CFA), InvestmentMarkets
Related Articles
-rev76nk32o2qbrmnygt6.png)
-cjqoall8pxc4nlocz98x.png)
Investments You May Like

Waterhouse VC
Waterhouse VC seekss attractive investment returns for wholesale investors through highly targeted opportunities in the wagering and gaming industry.

Zagga Feeder Fund
The Fund provides the opportunity for regular, defensive interest income without a disproportionate increase in risk.

Pengana Axiom International Ethical Funds
The Fund invests principally in listed (or soon to be listed) international equities, will typically have 45 to 75 holdings and can invest in developed and emerging markets.
Recent Articles
View all articles-2qcb8s3gtfysdj1fuh5q.png)
-j3xsi8fignuf9umbuw1u.png)
-s5c0uf81il26meg3icyx.png)