-cjqoall8pxc4nlocz98x.png)
We Ran the Efficient Frontier to Find the Ultimate 5-ETF Portfolios
It’s one thing committing to your investment plan and regularly investing to ensure your portfolio compounds into the wealth you’re aiming for.
It’s another thing entirely knowing the right ETF weightings to optimise your long-term risk-adjusted returns.
To help address this knowledge gap which so many investors face, we did what a portfolio manager would do: we fed real, forward-looking return, risk and correlation estimates into a mean-variance optimiser, and tested a series of five-ETF combinations.
The output was three distinct portfolios for conservative, balanced and aggressive investors.
The answers surprised us. The lessons about what optimisers get wrong are as valuable as the portfolios themselves.
Key Takeaways
- The winning five-ETF toolkit combines three Global X ETFs (A300, USTB and GXLD) with Vanguard’s VGS and VGE, at weighted fees of just 0.16-0.19% p.a..
- Our model Balanced portfolio targets a 6.3% p.a. return with 17% less volatility than a typical 70/30 portfolio delivering a similar return.
- Gold and currency-hedged US Treasuries do the heavy lifting in terms of diversification benefits for Australian investors.
- However, an unconstrained optimiser produces extreme, fragile portfolios. Sensible guardrails cost little in expected returns, and make the results far more robust.
- Every number here is an estimate. Treat these portfolios as frameworks to consider, rather than recipes or advice.
Explore 100's of investment opportunities and find your next hidden gem!
Search and compare a purposely broad range of investments and connect directly with product issuers.
A 74-Year-Old Idea That Still Does the Heavy Lifting
In 1952, Harry Markowitz showed in his famous research paper, ‘Portfolio Selection’, that what matters most for risk-adjusted returns is how investments move relative to one another.
Combine assets that zig and zag at different times, and you can earn the same return with less risk.
Plot the best possible portfolio combinations at various risk levels and you get the efficient frontier: the curve along which no portfolio can earn more without taking more risk.
This valuable theory earned him a share of the 1990 Nobel Memorial Prize in Economic Sciences and still underpins almost every diversification strategy.
The Shortlist of ETFs
Of course, the efficient frontier is only as useful as its inputs.
Historical returns are often a poor guide, because the past decade of US tech dominance would push any optimiser to fill a portfolio with Nasdaq ETFs.
Instead, we used J.P. Morgan Asset Management’s 2026 Long-Term Capital Market Assumptions in Australian dollars, one of the most widely used sets of 10- to 15-year forecasts in the industry.
It expects Australian shares to return 7.0% a year, global shares 6.5%, emerging markets 7.3%, gold 5.0%, hedged US Treasuries 4.4% and cash 3.4%, and supplies the volatility and correlation estimates needed to map the frontier.
We deducted each ETF’s management fee.
Here are the seven candidates we settled on for this analysis:
Role | ETF | Fee (% p.a.) | Why it made the list |
Australian shares | 0.03 | Broadest, cheapest local index exposure | |
Global shares | 0.18 | Global X has no market-cap world ex-Australia fund | |
Emerging markets | 0.48 | Low-cost broad exposure; no broad Global X option | |
US government bonds | 0.19 | Defensive ballast, hedged to the dollar | |
Australian bonds | 0.10 | Low-cost local bond benchmark | |
Gold | 0.14 | Among the cheapest gold exposures on the ASX | |
Cash | 0.18 | Low-risk cash anchor |
We then tested all 21 possible five-ETF combinations, scoring each on the return it could deliver at three distinct risk levels.
The Trap: What The Raw Optimiser Wanted
Left to its own devices, the optimiser produced an aggressive portfolio with half or more in Australian shares, a quarter or more in emerging markets, and just 5% in global developed shares.
Whilst that’s optimal on paper given the forecasts, it isn’t optimal in practice.
It happens because J.P. Morgan’s forecasts slightly favour Australian and emerging market shares, and an optimiser treats small forecast differences as gospel.
Richard Michaud famously described optimisers as ‘estimation-error maximizers’ for this reason.
The fix is guardrails.
We required at least 5% in each ETF, capped gold at 10%, kept emerging markets to no more than half of total global shares (VGS plus VGE), and stopped Australian shares from exceeding that total global shares allocation.
The cost in terms of risk-adjusted returns was minor: the guardrailed frontier’s returns sit only 0.1–0.2 percentage points below the unconstrained one, as shown below.
The guardrailed five-ETF frontier sits just below the unconstrained one and well above a typical 70/30 portfolio. 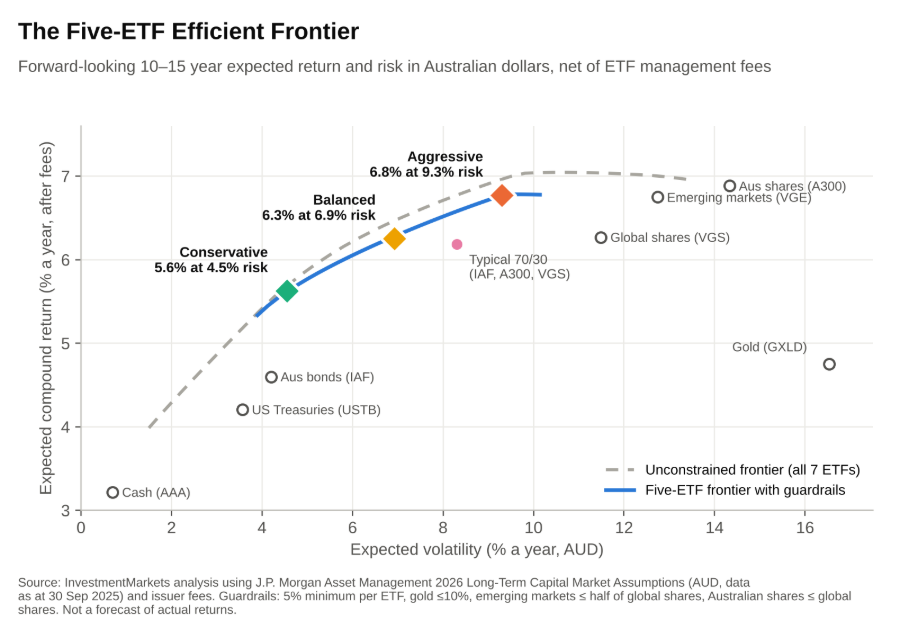
Source: InvestmentMarkets analysis using J.P. Morgan 2026 LTCMA (AUD).
The Three Portfolios
Now to the winning portfolios.
They comprise A300, VGS, VGE, USTB and GXLD in the three distinctly different proportions shown below.
The guardrailed five-ETF frontier sits just below the unconstrained one and well above a typical 70/30 portfolio. 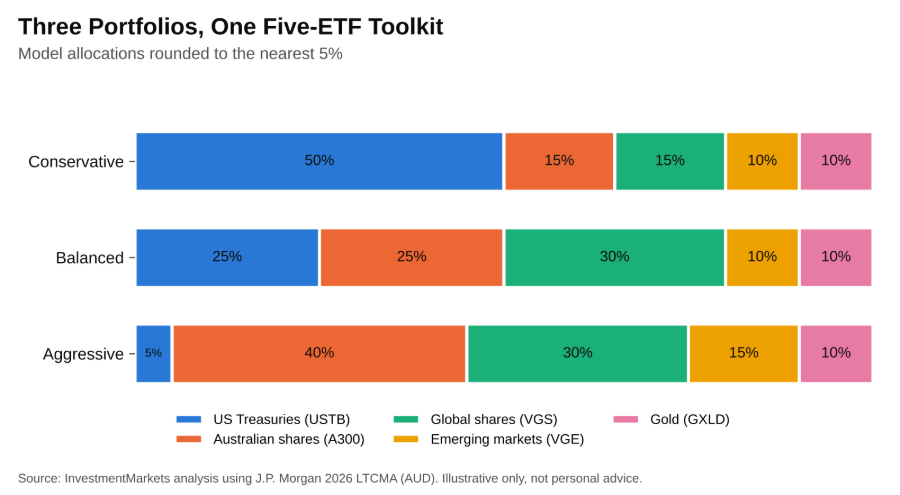
Source: InvestmentMarkets analysis using J.P. Morgan 2026 LTCMA (AUD).
Portfolio | Expected return | Volatility | Weighted fee | |||||
Conservative | 50% | 15% | 15% | 10% | 10% | 5.6% | 4.5% | 0.19% |
Balanced | 25% | 25% | 30% | 10% | 10% | 6.3% | 6.9% | 0.17% |
Aggressive | 5% | 40% | 30% | 15% | 10% | 6.8% | 9.3% | 0.16% |
The expected returns are annual compounded estimates after fees.
On that basis, in dollar terms, $100,000 would grow to about $172,000, $184,000 and $193,000 respectively over 10 years if the forecasts were met.
Using the same model, a 1-in-20 bad year would mean losses of 2%, 5% and 8% across the risk spectrum of portfolios.
A comparison with conventional portfolios is worthwhile here.
A typical 70/30 mix of IAF, A300 and VGS has an expected return of 6.2% with 8.3% volatility.
The modelled Balanced portfolio expects 6.3% with 6.9% volatility.
The modelled Aggressive portfolio expects slightly more than a 100% equities portfolio (6.8% versus 6.7%) with about a fifth less volatility (9.3% versus 11.5%).
Where The Diversification Benefits Come From
Two assets do most of the diversification work in these model portfolios.
- Gold priced in Australian dollars is expected to move against Australian equities (with a correlation of minus 0.37) because the dollar tends to fall in a crisis just as gold rises.
- Hedged US Treasuries have a slightly negative correlation with shares, which is why the model marginally preferred USTB to Australian bonds.
Expected correlations in Australian dollars. Source: J.P. Morgan 2026 LTCMA. 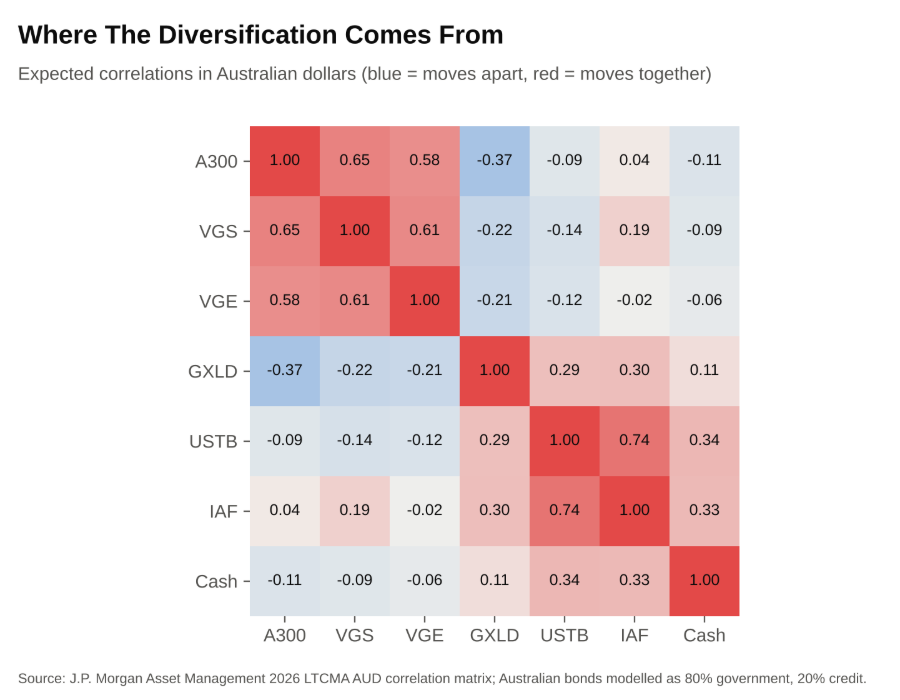
IAF offers a higher expected return, while USTB offers lower volatility and better diversification.
At the same level of risk, an IAF-based version of each portfolio delivered almost identical expected returns, within about 0.05 percentage points a year in our tests. Investors who prefer domestic bonds, or who want to avoid relying on US government debt, lose almost nothing by making that switch.
Today’s starting yields also influence the returns both of these assets are likely to deliver from here.
With the Australian 10-year yield above 5% and the RBA cash rate of 4.60% above the US federal funds rate of 3.75–4%, both bond markets currently offer more than the forecasts used in the analysis.
The Fine Print
Of course, forecasts are just current expectations of the future.
In truth, no one knows what’s coming.
Vanguard’s Q4 2025 asset allocation report is more cautious than J.P. Morgan’s, projecting 5.8% p.a. returns for Australian shares and 5.6% p.a. for global shares.
Plug in Vanguard’s numbers where available (Australian shares, global shares and hedged global bonds, keeping J.P. Morgan’s forecasts for emerging markets and gold) and our three portfolios would return about 5.2% p.a., 5.7% p.a. and 6.0% p.a.
Volatility also understates the pain. Models never fully capture the swings investors need to be prepared to sit through.
For example, the ASX 200 fell more than 50% peak to trough in the global financial crisis, and in 2022 shares and bonds fell together.
Gold’s diversifying role could weaken if the Australian dollar stops acting as a shock absorber.
Also, any five-ETF portfolio needs rebalancing, typically once a year or when weights drift by more than five percentage points, to stay on the frontier.
Efficient Honesty
The efficient frontier can’t predict the future, but it is the most honest tool available for turning realistic expectations into optimised portfolios.
Our analysis suggests a small set of low-cost ETFs can build conservative, balanced and aggressive portfolios that sit close to the efficient frontier’s theoretical best, at competitive fees.
Use forward-looking inputs, add guardrails, rebalance, and remember that several portfolios can be almost equally good.
Explore the building blocks on our Australian ETFs, global ETFs, emerging markets ETFs, bond fund ETFs and gold ETFs pages.
For more on structuring an ETF portfolio, read 6 ETF Secrets the Super-Rich Use to Their Advantage.
Frequently Asked Questions
What Is the Efficient Frontier?
The efficient frontier is the set of portfolios that offer the highest expected return for each level of risk. It was developed by Harry Markowitz in 1952 and is the foundation of modern portfolio theory.
What Is the Best 5-ETF Portfolio for Australian Investors?
There is no single optimal portfolio for everyone.
Our efficient frontier analysis, using J.P. Morgan’s 2026 Long-Term Capital Market Assumptions, favoured a combination of A300, VGS, VGE, USTB and GXLD. Our Balanced model (25% USTB, 25% A300, 30% VGS, 10% VGE and 10% GXLD) targets about 6.3% a year with 6.9% volatility, at a weighted fee of 0.17% a year.
Can You Build a Diversified Portfolio with Only Five ETFs?
Yes. Five broad ETFs covering Australian shares, global shares, emerging markets, bonds and gold give exposure to thousands of securities. Our analysis found that applying sensible guardrails to a five-ETF portfolio cost only about 0.1–0.2 percentage points a year in expected return versus the unconstrained optimum.
Why Include Gold in an ETF Portfolio?
For Australian investors, unhedged gold has historically tended to rise when shares fall, partly because the Australian dollar usually weakens in a crisis. J.P. Morgan expects a correlation of minus 0.37 between gold and Australian shares in Australian dollar terms.
Are Currency-Hedged Bond ETFs Better Than Australian Bond ETFs?
Not necessarily. In our model, hedged US Treasuries were better diversifiers than Australian composite bonds, while Australian bonds offered a higher expected return. At the same level of risk, the two produced almost identical portfolio returns, so both are reasonable defensive options.
How Often Should a Five-ETF Portfolio Be Rebalanced?
Many investors rebalance annually or when an allocation drifts more than five percentage points from target. This article is general information only and does not consider your personal circumstances; consider seeking professional advice.
Disclaimer: This article is prepared by Simon Turner. It is for educational purposes only. While all reasonable care has been taken by the author in the preparation of this information, the author and InvestmentMarkets (Aust) Pty. Ltd. as publisher take no responsibility for any actions taken based on information contained herein or for any errors or omissions within it. Interested parties should seek independent professional advice prior to acting on any information presented. Please note past performance is not a reliable indicator of future performance.
Author

Simon Turner
Head of Content (CFA), InvestmentMarkets
Related Articles
-drhkgsdwk8x3oqxim0go.png)
-uo4eg7ge0ysewqkveu92.png)
Investments You May Like

JPMorgan Global Bond Active ETF (Managed Fund) (Cboe: JPGB)
The Fund objective is to achieve a return in excess of global bond markets.
Categories
Recent Articles
View all articles
-kb76wojwxzr2l83lrgb4.png)
-rev76nk32o2qbrmnygt6.png)