Exchange Traded Funds (ETFs) in Australia
Compare the exchange traded funds listed on InvestmentMarkets by category, objective and investor type. Where the issuer has published them, listings show fees, minimum investment and liquidity, with the offer document linked.
We don’t rank ETFs. To choose one, there are five main angles to investigate:
1. Cost: the management fee plus what you pay to trade. On the listing, where the issuer has published it.
2. What it tracks: the index or strategy behind the fund. In the offer document.
3. Liquidity: how easily units trade at a fair price. On the listing, where the issuer has published it.
4. Currency hedging: whether overseas returns move with the Australian dollar. In the offer document.
5. Domicile: whether the fund is an Australian trust or cross-listed from overseas. In the offer document.
How to Choose an Australian ETF
Past performance is the number most investors focus on first, and on its own it tells you the least.
These five checks tell you what you are actually buying, what it will cost to own and how it will behave when markets move. Run them on any ETF before you compare returns, and run them in the same order every time.
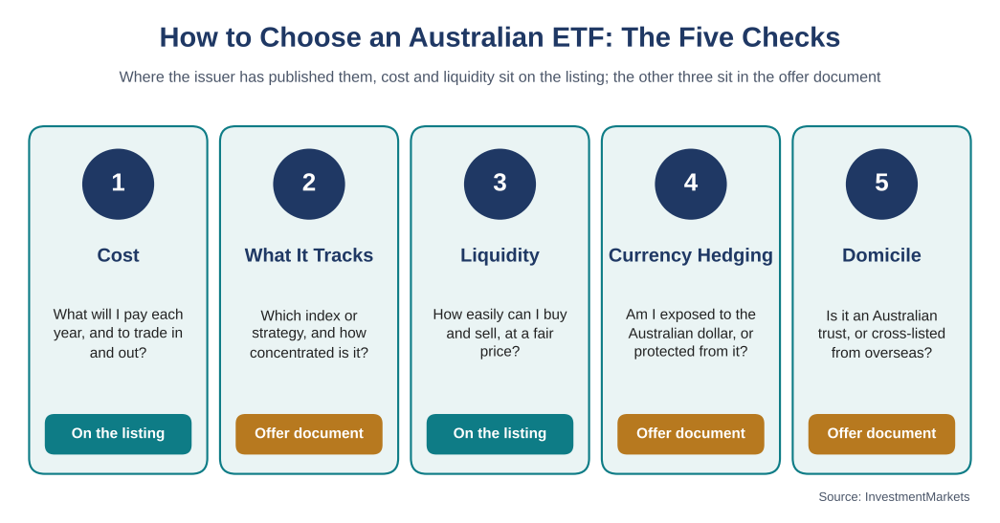
The five checks, and where to find the answer to each. Source: InvestmentMarkets
Table 1: The five checks at a glance.
Check 1: What It Costs
Start with the management fee, usually shown as the management cost or expense ratio, then add brokerage and the bid-ask spread you pay every time you trade. A gap of a few tenths of a percent a year compounds into thousands of dollars over a long holding period, so compare fees between ETFs that track the same market.
Check 2: What It Tracks
Find the exact index or strategy, how it is weighted and how much of the fund sits in its top ten holdings, because two ETFs with similar names can own very different portfolios. A broad index fund tracking the S&P/ASX 200 behaves nothing like a thematic or active ETF, even when both sit in the same category.
Check 3: How Liquid It Is
Look at average trading volume and the bid-ask spread, but remember that an ETF’s real liquidity comes from its underlying holdings and its market maker, not just the trades you see on screen. Wide spreads on small or niche funds are a hidden cost you pay on the way in and again on the way out.
Check 4: Whether It Is Currency Hedged
An unhedged global ETF gains when the Australian dollar falls and loses when it rises, while a hedged version strips most of that currency effect out for a small extra cost. Neither is right or wrong, but you should know which one you are buying, as many issuers offer both versions of the same index, and currency-hedged ETFs have their own category on InvestmentMarkets.
Check 5: Where It Is Domiciled
Most ETFs quoted on the ASX are Australian unit trusts, but some are US-domiciled funds cross-listed here, which can mean a W-8BEN form, different withholding tax and potential US estate tax exposure. Domicile also shapes how distributions, franking credits and annual tax statements reach you.
What We Do and Don’t Do
InvestmentMarkets is the place to find and compare investments and to connect directly with the issuers behind them. We are not a ranking site, and we don’t tell you which ETF to buy. Here is exactly where the line sits.
Table 2: What InvestmentMarkets does and doesn’t do.
ETF Categories You Can Compare
Every category below has its own listing page, so you can narrow the field before you start the five checks.
Table 3: ETF categories on InvestmentMarkets. Click a category to see its listings.
Exchange Traded Funds: A Complete Australian Investor’s Guide
Now for the detail. This guide explains how exchange traded funds work, the different types available in Australia, what they cost, where the risks hide and how investors use them to build diversified portfolios. Read it end to end, or jump to the section you need from the menu at the top of the page.
What Is an ETF (Exchange Traded Fund)?
An exchange traded fund (ETF), also written exchange-traded fund, is a managed investment fund whose units trade on a stock exchange such as the ASX or Cboe, just like shares. Instead of buying individual securities, you buy units in the ETF, which holds a diversified basket of underlying assets such as shares, bonds or commodities.
Most ETFs are index funds: they aim to replicate the performance of a benchmark such as the S&P/ASX 200, giving you broad market access in a single, cost-efficient trade.
ETFs vs Traditional Managed Funds vs Individual Shares
Compared with traditional managed funds, ETFs offer:
• Intraday trading, so you can buy or sell during market hours
• Transparent holdings
• Generally lower ongoing fees
Conventional managed funds, by contrast, usually price once a day and may be actively managed at a higher cost.
Compared with buying individual shares, ETFs give you:
• Built-in diversification, which reduces single-company risk
• Liquidity and ease of execution
ETFs are now firmly mainstream.
Australian ETF assets grew from around A$172 billion to A$239 billion during 2024, and Betashares reports the industry closed 2025 at a record A$330.6 billion after roughly A$53 billion of net inflows. By mid-2026 it was closing in on A$400 billion. The ASX has described the local market’s growth as phenomenal.
Retail investors, self-managed super funds (SMSFs) and large institutions all use ETFs for the same reasons: diversification, transparency, liquidity and low cost.
For many, they are the simplest route to a portfolio that spans asset classes and markets with minimal friction.
Index Funds Australia: How Index ETFs Fit In
An index fund is any fund that aims to match a market index rather than beat it. In Australia, most index funds are now bought as ETFs on the ASX, although some unlisted index managed funds are still available directly from managers.
Popular index funds tend to cluster around a handful of well-known benchmarks. We don’t rank them, and popularity on its own is not a reason to buy, but knowing the benchmark is the fastest way to compare like with like.
Table 4: Benchmarks commonly tracked by index funds in Australia.
Two funds tracking the same index can still differ on cost, tracking accuracy, hedging and domicile, which is why the five checks matter even for the simplest index fund.
How Do ETFs Work?
The ETF Structure
ETFs are open-ended trusts: they issue new units or redeem existing ones in response to investor demand.
As Moneysmart puts it, ‘ETF units can be created or redeemed to match investor demand’. That mechanism keeps the market price close to the fund’s net asset value (NAV).
Authorised participants, usually large institutions, make it work by delivering baskets of the underlying assets to the ETF issuer in exchange for new units, or the reverse.
Market makers then quote buy and sell prices on the exchange throughout the day.
Meet the ETF Market Maker explains who they are and why they matter to you.
Physical vs Synthetic ETFs
ETFs are either physically backed or synthetic.
A physical ETF directly holds the shares, bonds or commodities in its benchmark; a synthetic ETF uses derivatives such as swaps to copy the index, which Moneysmart notes carries the extra risk that the counterparty fails. Synthetic funds are generally labelled as such in their offer documents.
In Australia, physically backed ETFs are the norm.
Trading Throughout the Day
Unlike traditional managed funds, which are generally priced once a day, ETFs trade continuously during market hours, with prices moving on supply and demand and on the value of the underlying assets.
You buy and sell them through a stockbroker in exactly the way you would trade shares (Moneysmart).
Settlement takes place two business days after the trade (T+2).
Intraday trading combined with NAV-tracking mechanisms makes ETFs both flexible and efficient.
Types of ETFs Available in Australia
ETFs now cover virtually every asset class and strategy. The table gives the quick view; the sections below go deeper, with an example listing for each.
Table 5: ETF types at a glance. Fee ranges are indicative only; check the listing or offer document for each fund.
Broad Market Index ETFs
Broad market index ETFs aim to replicate major indices such as the S&P/ASX 200, the S&P/ASX 300 or global benchmarks like the S&P 500. They deliver diversified exposure to entire markets or regions, often at very low cost, with management fees commonly between 0.03% and 0.10% p.a.
Most Australian ETFs are passively managed in this way.
For example, Global X Australia 300 ETF (ASX: A300) tracks the 300 largest companies on the ASX.
Compare similar funds among our Australian ETFs and global ETFs.
Sector and Industry ETFs
Sector ETFs concentrate on a single part of the market, such as technology, healthcare, financials, energy, real estate or resources. They let you tilt towards industries you expect to outperform, but because the holdings are narrower, they carry more concentration risk than broad market funds.
For example, Global X Semiconductor ETF (ASX: SEMI) targets global semiconductor companies.
For a sense of how concentrated that industry’s risks can be, read Taiwan, TSMC and the Kill Switch.
Fixed Income and Bond ETFs
Bond ETFs invest in government or corporate bonds and other fixed income securities, paying regular income distributions. They range from conservative government bond exposure to higher-yielding corporate debt, across domestic and international markets, and are a core building block for income-focused portfolios.
For example, Betashares Australian Composite Bond ETF (ASX: OZBD) is a diversified Australian bond ETF.
For the bigger picture on yields, see What the US Treasury’s Yield Battle Means for Australian Investors.
Commodity and Currency ETFs
Commodity ETFs provide exposure to gold, silver, oil, agriculture or the companies that produce them, while currency ETFs track exchange rates.
Canstar notes that commodity ETFs come in two forms, physical and synthetic, with synthetic versions holding financial contracts rather than the commodity itself.
Investors often use them as a hedge or as protection against inflation.
For example, Global X Copper Miners ETF (ASX: WIRE) focuses on copper mining companies.
Browse gold ETFs and other commodity ETFs, and read The Alternatives Showdown: Gold Bullion vs Gold Miners vs Bitcoin.
Smart Beta and Factor ETFs
Smart beta ETFs follow rules-based strategies that go beyond simple market-cap weighting, tilting towards factors such as value, quality, momentum or low volatility.
The aim is better returns or lower risk than a classic index.
For an honest look at what they can and can’t do, read Smart Beta Without the Marketing Spin.
Thematic and ESG ETFs
Thematic ETFs are built around long-term trends such as renewable energy, AI, robotics or cybersecurity, while ESG ETFs screen their portfolios on environmental, social and governance criteria.
Both are popular with values-driven and trend-focused investors, but they usually charge more than plain index ETFs. Explore thematic ETFs, ESG ETFs and our wider ESG investing listings.
For example, Global X Cybersecurity ETF (ASX: BUGG) offers targeted access to the cybersecurity theme.
Active ETFs (Exchange Quoted Managed Funds)
Unlike passive ETFs, active ETFs are run by a manager trying to beat a benchmark.
In Australia they must include ‘Active’ in their name, and they typically charge more, often 0.50% to 1.50% p.a.
Stockhead points out that most ETFs are still passive, so active ETFs remain a minority, if a fast-growing one.
For example, JPMorgan Global Research Enhanced Index Equity Active ETF (ASX: JREG) blends index exposure with active stock selection.
Compare more active ETFs.
Complex ETFs (Geared and Inverse)
Geared, or leveraged, ETFs amplify index returns (for example two or three times), while inverse ETFs aim to profit when markets fall. In Australia these funds must carry ‘Complex’ in their name.
They suit only sophisticated or tactical investors; see geared ETFs.
Other ETF Categories
The ETF menu keeps widening.
Cash ETFs, private credit ETFs, digital asset ETFs, private equity ETFs, infrastructure ETFs, property ETFs and diversified income ETFs all have their own listing pages on InvestmentMarkets.
Key Benefits of ETFs for Investors
Instant Diversification
A single ETF can spread your money across dozens, or even thousands, of securities.
As InvestSMART explains, one purchase can give you exposure across asset classes, sectors and regions, reducing concentration risk and opening up markets that would be costly or difficult to access directly.
Cost-Effectiveness
ETFs are among the most cost-efficient investments available.
CommSec notes that ETF management fees are typically much lower than those of traditional managed funds, with no entry or exit fees beyond brokerage.
Because most ETFs track an index, low portfolio turnover also keeps transaction costs and capital gains tax down.
Liquidity and Trading Flexibility
ETFs trade on the ASX like shares, so you can buy or sell throughout the trading day using the same tools you would for shares, including limit orders and stop losses (CommSec).
Settlement through the ASX CHESS system adds a layer of security and transparency.
Transparency
Many ETF issuers, particularly of index ETFs, publish their full holdings daily, so you can see exactly what you own and track the fund’s value as you go (CommSec).
Accessibility
ETFs are open to everyone, from first-time investors to SMSFs and institutions, through any standard online broker.
InvestSMART notes there is no minimum investment beyond your broker’s requirements, which makes ETFs a simple entry point to diversified investing.
Flexibility in Portfolio Construction
ETFs work well as the foundation of a ‘core-satellite’ strategy, combining diversified index exposure with tactical themes or direct shares. Rebalancing is as simple as buying or selling units.
For ideas on how sophisticated investors use them, read 6 ETF Secrets the Super-Rich Use to Their Advantage.
Risks and Considerations When Investing in ETFs
ETFs have many advantages, but they are not risk-free.
Here is what to understand before you invest.
Table 6: ETF risks and where to check them.
Market and Asset Risk
Because ETFs track indices or assets, they are fully exposed to market downturns: if the underlying index falls, so does the ETF (Moneysmart).
Concentration risk is higher in sector and thematic ETFs, and niche, emerging-market and small-cap ETFs tend to be more volatile.
Beyond the Magnificent Seven looks at how concentrated even broad indices have become.
Tracking Error
ETF returns can drift from the index they aim to replicate because of fees, transaction costs, dividend timing, sampling methods and rebalancing.
As Canstar points out, fees alone mean your return will never exactly match the index.
Always check an ETF’s historical tracking difference before you invest.
Liquidity Risk
Not every ETF trades heavily.
For niche, small or international ETFs, liquidity may be limited, leading to wider bid-ask spreads and difficulty executing large trades without moving the price; Canstar warns there is no guarantee of a liquid market in every circumstance.
Small funds can also close, which What Happens When an ETF Closes? explains in plain terms.
Currency Risk
International ETFs expose you to movements in the Australian dollar. If the dollar strengthens, foreign returns shrink; if it weakens, they grow.
Moneysmart notes that some ETFs are currency hedged to remove this risk, although hedging adds cost.
Compare currency-hedged ETFs.
Counterparty Risk (Synthetic ETFs)
Synthetic ETFs use derivatives such as swaps, which introduces the risk that the counterparty fails (Moneysmart).
Physically backed ETFs dominate in Australia, but always check the structure.
Dividend and Distribution Timing
ETF distributions may not line up with the dividend schedules of the underlying companies, which can affect cash flow for income-focused investors.
Franking credits can also be diluted in some fund structures, reducing the tax benefit.
Complexity Risk (Geared and Inverse ETFs)
Complex ETFs use derivatives or borrowing to magnify returns or deliver inverse performance.
Daily rebalancing, path dependency and, above all, amplified losses make them generally unsuitable for long-term investors.
How to Invest in ETFs in Australia
There are five main routes into ETFs. The ETFs are the same; what changes is the cost, the control you keep and the convenience you get.
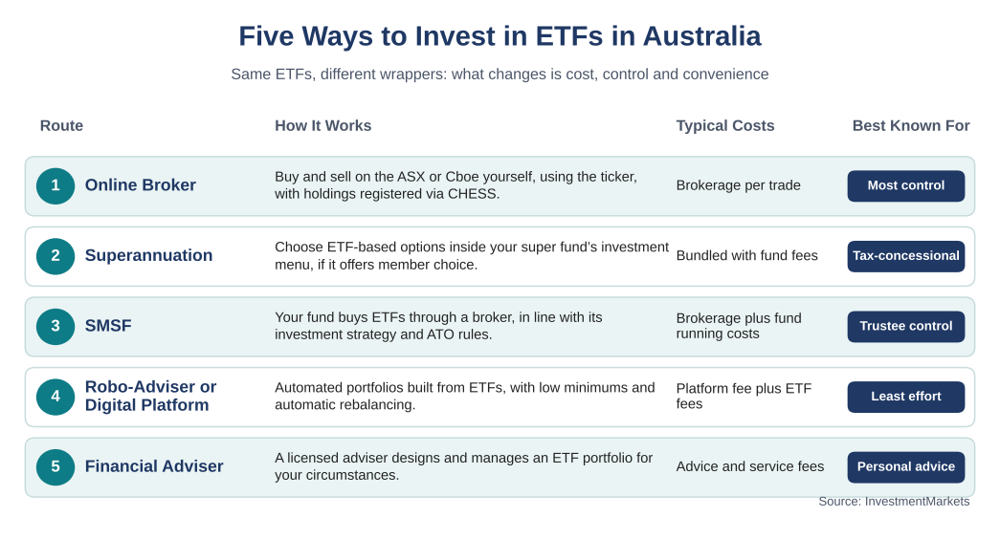
Five ways to invest in ETFs in Australia. Source: InvestmentMarkets
Through an Online Broker or Trading Platform
ETFs trade on a stock exchange just like ordinary shares, so most retail investors buy them through a brokerage account with platforms such as CommSec, NAB Trade or SelfWealth. Brokerage typically ranges from about $5 to $20 per trade depending on the platform and trade size. You place orders using the ETF’s ticker, and settlement runs through CHESS.
Within Superannuation
Many super funds and retail super platforms include ETF options on their investment menus. If your fund offers member choice, you can direct part of your balance to ETFs and benefit from super’s concessional tax environment, although fees may be bundled into the fund’s administration costs.
Through Self-Managed Super Funds (SMSFs)
SMSFs can buy ETFs directly through a brokerage account, in line with the fund’s investment strategy and diversification rules. Liquidity matters, especially in pension phase. Trustees must also keep proper records, comply with ATO rules and make sure holdings match the fund’s objectives. Explore investments suited to SMSFs.
Via Robo-Advisers and Digital Investment Platforms
Automated platforms such as Raiz, Spaceship and Stockspot use ETFs as building blocks for diversified portfolios matched to your risk profile. They often have low minimums (some as low as $5), rebalance automatically and charge platform fees, usually 0.5% to 1.5% p.a. on top of the underlying ETF fees.
Finder compares low-cost ETF brokers and platforms.
Through Financial Advisers
Full-service brokers and licensed financial advisers can build a bespoke ETF portfolio, advising on asset allocation, selection and strategy. It costs more, reflecting advice and service fees, but can suit investors who want a guided approach.
Still deciding where to hold your ETFs? Read Platform, Broker or Direct.
Going Deeper: How to Compare ETFs Side by Side
The five checks at the top of this page are the essentials. Once two or three ETFs pass them, these eight factors help you separate the finalists.
Management Fees and Expense Ratios
Compare management expense ratios (MER) across similar ETFs, because fees erode returns every single year. The total cost of ownership also includes bid-ask spreads and tracking difference.
Table 7: Indicative fee ranges by ETF type.
Don’t simply pick the lowest fee. Weigh cost against liquidity, tracking and structure.
Fund Size and Liquidity
Larger funds with substantial assets under management tend to offer better liquidity, and ETFs with higher trading volumes generally have tighter spreads.
Smaller boutique ETFs, especially those under about $50 million, carry a higher risk of closure or illiquidity.
Tracking Performance
Review historical tracking error and tracking difference. Consistently close tracking signals efficient management.
Check, too, whether the ETF uses full replication or sampling, which affects tracking accuracy.
Index or Benchmark Methodology
Know exactly which benchmark the ETF follows. Is it market-cap weighted, equal weighted or a smart beta index? How often is it reconstituted?
The reputation of the index provider, such as S&P, MSCI or FTSE, matters too.
Distribution Yield and Frequency
Income investors should compare distribution yields and payment frequency (monthly, quarterly or half-yearly), along with the level and consistency of franking credits on Australian equity ETFs.
The Return of Australia’s Income Trade explores why income strategies have been in demand.
Compare equity income ETFs.
Tax Efficiency
ETFs are generally more tax-efficient than managed funds, but international ETFs may suffer withholding tax on dividends, and currency-hedged ETFs can have their own tax treatment.
Review each fund’s annual tax statement.
Fund Manager Reputation
Look for issuers with a proven Australian track record, check how long the fund has been running and gauge how committed the issuer is to the Australian market.
Holdings and Concentration
Review the top ten holdings and their weightings, and watch for over-concentration in a handful of companies or sectors.
Assess geographic and sector spread, and any overlap with what you already own.
Stockspot‘s comparison of Australian share ETFs, for example, weighs size, cost, slippage, liquidity, returns and track record.
To cut through the gloss on fund materials, read How to Read a Fund Factsheet Without Falling for the Marketing.
ETFs vs Managed Funds vs Individual Shares
How ETFs stack up against the alternatives, feature by feature.
Table 8: ETFs, managed funds and individual shares compared.
Tax Considerations for ETF Investors
Tax can make a real difference to what you keep. Here are the essentials.
Income Distributions
ETF distributions can include dividends, interest, foreign income and realised capital gains.
The ATO is clear that you must declare this income even if you reinvest it through a distribution reinvestment plan (DRP), and that distributions are taxed in the year they relate to, not when the cash arrives.
Many Australian equity ETFs also pass on franking credits.
Franking Credits
When an ETF holds Australian companies that pay franked dividends, you can usually claim those credits to reduce your tax, thanks to the dividend imputation system.
As CommSec explains, you generally need to meet the 45-day holding period rule, which is designed to stop short-term trading purely to collect franking credits.
Capital Gains Tax (CGT)
Selling ETF units at a profit triggers capital gains tax. Individuals who have held units for more than 12 months may qualify for the 50% CGT discount (up until 30th June 2027). Your cost base includes the purchase price, brokerage and reinvested distributions.
Tax Reporting
Issuers send annual tax statements showing income, franking credits and capital gains, and the ATO notes that much of this data is prefilled into myTax.
Keep records of purchase dates, units and distributions for at least five years. International ETFs add complexity: foreign income may be subject to withholding tax, and you may be able to claim a Foreign Income Tax Offset (FITO).
SMSF Considerations
Within an SMSF, investment income is taxed at 15% in accumulation phase and often 0% in pension phase. SMSFs receive a one-third CGT discount on assets held for more than 12 months, rather than the 50% discount available to individuals.
If your fund has both accumulation and pension accounts, an actuarial certificate may be needed to apportion income correctly.
Popular ETF Strategies in Australia
Six strategies account for most of the ways Australians use ETFs. The examples below are illustrations of the kinds of funds used, not recommendations.
ETF Strategy Comparison for Australian Investors
Table 9: Six common ETF strategies. Examples are illustrative, not recommendations.
Common ETF Investing Mistakes to Avoid
ETFs are simple to buy, which makes them easy to misuse. Even experienced investors fall into these traps.
Chasing Past Performance
Last year’s top-performing ETF is tempting, but results rarely repeat. Sectors that soar one year, such as technology or energy, often lag the next.
A disciplined, long-term strategy matched to your goals and risk tolerance beats the rear-view mirror.
Ignoring Fees and Costs
Small fee differences compound into thousands of dollars over decades. Count total costs, including management fees, spreads and brokerage.
The cheapest ETF isn’t always best, but cost discipline always matters.
Over-Diversification
Holding too many overlapping ETFs adds complexity without cutting risk. Check for duplicate holdings: a handful of well-chosen ETFs, often five to ten, is usually enough.
Timing the Market
Trying to buy low and sell high often means missing the rebound. Time in the market tends to beat timing the market, and regular investing through dollar-cost averaging smooths out volatility.
Neglecting Rebalancing
Portfolios drift from their targets over time. Rebalancing once or twice a year restores your intended risk profile, and you can often do it simply by directing new money to underweight holdings.
Hard Truths: How Often Should You Check Your Portfolio? offers a sensible rhythm.
Trading Too Frequently
Frequent trading racks up brokerage and tax. ETFs work best as long-term holdings, so resist reacting emotionally to short-term swings.
Patience Is an Investment Decision and Know Thyself: The Hardest Investment Skill to Master explain why.
Misunderstanding Geared and Complex ETFs
Leveraged and inverse ETFs are designed for short-term traders, not long-term investors. Daily rebalancing can erode performance over time, so use them only if you fully understand how they work.
The Future of ETFs in Australia
Market Growth Trends
The Australian ETF market keeps setting records. Assets rose from around A$172 billion to A$239 billion in 2024, roughly 38% growth in a single year, then reached a record A$330.6 billion by the end of 2025 (Betashares). By mid-2026 the industry was closing in on A$400 billion. Innovation, accessibility, low costs and rising use by super funds and robo-advisers all point to continued growth (ASX).
Product Innovation
Issuers are launching more specialised products: thematic and sector ETFs, active ETFs, fixed income and alternatives, ESG strategies, and newer categories such as private credit ETFs and digital asset ETFs. Zero-brokerage platforms and robo-advisers have widened retail participation further.
Regulatory Developments
Australian regulators continue to tighten oversight of ETFs, with improved disclosure for complex products, clearer naming conventions such as the ‘Active’ and ‘Complex’ labels, and closer supervision by the Australian Securities and Investments Commission (ASIC) to protect retail investors.
The ASX also highlights the growing role of market makers and transparency in keeping ETF trading fair.
What This Means for Investors
• ETFs have moved from niche to mainstream in Australian portfolios.
• More choice means more need to check costs, strategic fit and overlap before you buy.
• Regulation is improving investor protection, but simpler, transparent ETFs remain the prudent starting point.
• Institutional adoption brings more competition, which may tighten spreads and fees and improve liquidity.