
 Limited")
Invest in the largest 300 Australian companies listed on the ASX.
Objective
Growth and Income
Category
ETFs
Min. Investment
$500
Liquidity
Listed
Availability
Open for investment
Funding Stage
Listed
Structure
ETF
So, your investment plan is ready and assumes you know how to find the best funds and ETFs to execute your plan. But with over 10,000 managed investment products that Australian investors can pick from, seeing the wood for the trees is easier said than done.
Where do you start? How do you compare all the available funds and ETFs like a professional investor who knows how to cut through the noise?
Join us on a deep dive into comparing funds…
The first thing you need to understand is that process is the answer.
Rather than reacting to emotions, or picking funds based on last year’s returns, successful investors apply a structured framework that compares fund objectives, strategy, performance, fees, risk, and portfolio fit.
That may sound daunting, but it’s not.
Here are 10 simple steps you can follow that will enable you to find the right funds and ETFs to execute your investment plan and meet your goals:
The process begins by asking a simple but critical question: what objective am I looking to achieve?
This can hopefully be answered by consulting your investment plan, which should include details of your goal, your time horizon, your income vs growth priority, your risk tolerance (how much drawdown you can actually tolerate), and your tax position (marginal rate, use of super, trust structures).
For many investors, their objective is similar: Long-term capital growth with growing income and tax drag minimised.
That may translate into an asset allocation plan along the lines of:
So, let’s start the search for the first item on the list: Australian equity funds and ETFs.
Funds and ETFs should only be compared with funds within the same category and with similar objectives.
So, in this example, we’re looking for Australian equity funds and ETFs that generate long-term capital growth with growing income and tax drag minimised.
Next question: Should we focus on funds or ETFs?
Back to the investment plan for clarity. This investor is focused on minimising fees, so let’s prioritise ETFs in the search while viewing managed funds opportunistically.
So, let’s start comparing a few leading Australian equity ETFs versus our objective.
Given our goal is to generate rising income as well as capital growth, let’s focus on the two ETFs that tick both boxes: Vanguard Australian Shares High Yield ETF (ASX: VHY) and Dimensional Australian Value Active ETF (ASX: DAVA).
Both are Australian equity ETFs, but they consist of entirely different portfolios.
This is when professional investors dig deeper. They look through a fund’s label and analyse its underlying holdings, sector exposure and diversification.
Here’s what we discover when looking through these two ETFs:

Source: Vanguard
There are a couple of key takeaways for the discerning investor:
Source: Dimensional
There are also a couple of useful takeaways here:
You’ll notice both ETFs have a similar level of concentration and sector exposure.
With that context, let’s move to the next step.
Search and compare a purposely broad range of investments and connect directly with product issuers.
Time to check out performance.
Retail investors often fall into the trap of chasing one-year returns.
However, this strategy tends to result in lower risk-adjusted returns with investors buying high and selling low. Instead, professionals focus on consistency of returns across various cycles.
On that note, here’s a comparison of the performance of our two leading contenders over short- and long-term timeframes:

For this step, Dimensional Australian Value Active ETF (ASX: DAVA) has the edge over all timeframes.
On to fees next.
According to Vanguard, ETF fees in Australia range from 0.03% p.a. to 1.25% p.a.
Fee differences may seem small, but even minor differences can compound significantly over time.
For the two ETFs being compared: Vanguard Australian Shares High Yield ETF (ASX: VHY) charges a 0.25% management fee, which is below the 0.335% charged by Dimensional Australian Value Active ETF (ASX: DAVA).
It’s a relatively small differential, but that’s a tick for Vanguard Australian Shares High Yield ETF (ASX: VHY).
Tip: Higher fees may be acceptable if there is a clear, repeatable edge. Otherwise, cost drag will erode returns over time.
A fund’s return means little without understanding the risk taken to achieve it.
It’s important to understand that during market downturns, high-risk, high-growth funds can experience sharp drawdowns, while bond funds tend to cushion portfolio declines.
Bear in mind that a 30% loss requires a 43% gain to recover. Hence, professionals prioritise downside protection as much as upside potential.
Consistency of returns means looking back for a view of how a fund performed during an extreme market selloff. Thankfully, we have a relatively recent extreme market selloff to guide us: the pandemic.
During the pandemic:
That’s a small win to Dimensional Australian Value Active ETF (ASX: DAVA).
Investors tend to invest in ETFs for their immediate diversification benefits: lower portfolio volatility and improved risk-adjusted returns.
But to achieve this, they need to ensure they are sufficiently diversified to meet their objectives.
To our fund comparison:
It’s fair to say both ETFs tick our objectives on this front.
Tip: Every fund or ETF must earn its place by improving the overall portfolio, not just by looking attractive in isolation.
Liquidity is often overlooked by retail investors, but it’s critical.
Larger funds tend to be more liquid, cost-efficient, and operationally stable.
So, let’s check-in on the market caps of the two ETFs we’re comparing:
That’s a liquidity and size advantage to Vanguard Australian Shares High Yield ETF (ASX: VHY), although Dimensional Australian Value Active ETF (ASX: DAVA) also offers excellent liquidity.
Why it matters: Liquidity affects your ability to enter and exit positions efficiently, particularly in volatile markets.
Platforms like InvestmentMarkets provide a genuine edge during the fund comparison process.
Instead of manually comparing fund disclosure documents, you can:
For example, here’s the site’s comparison of these two ETFs:
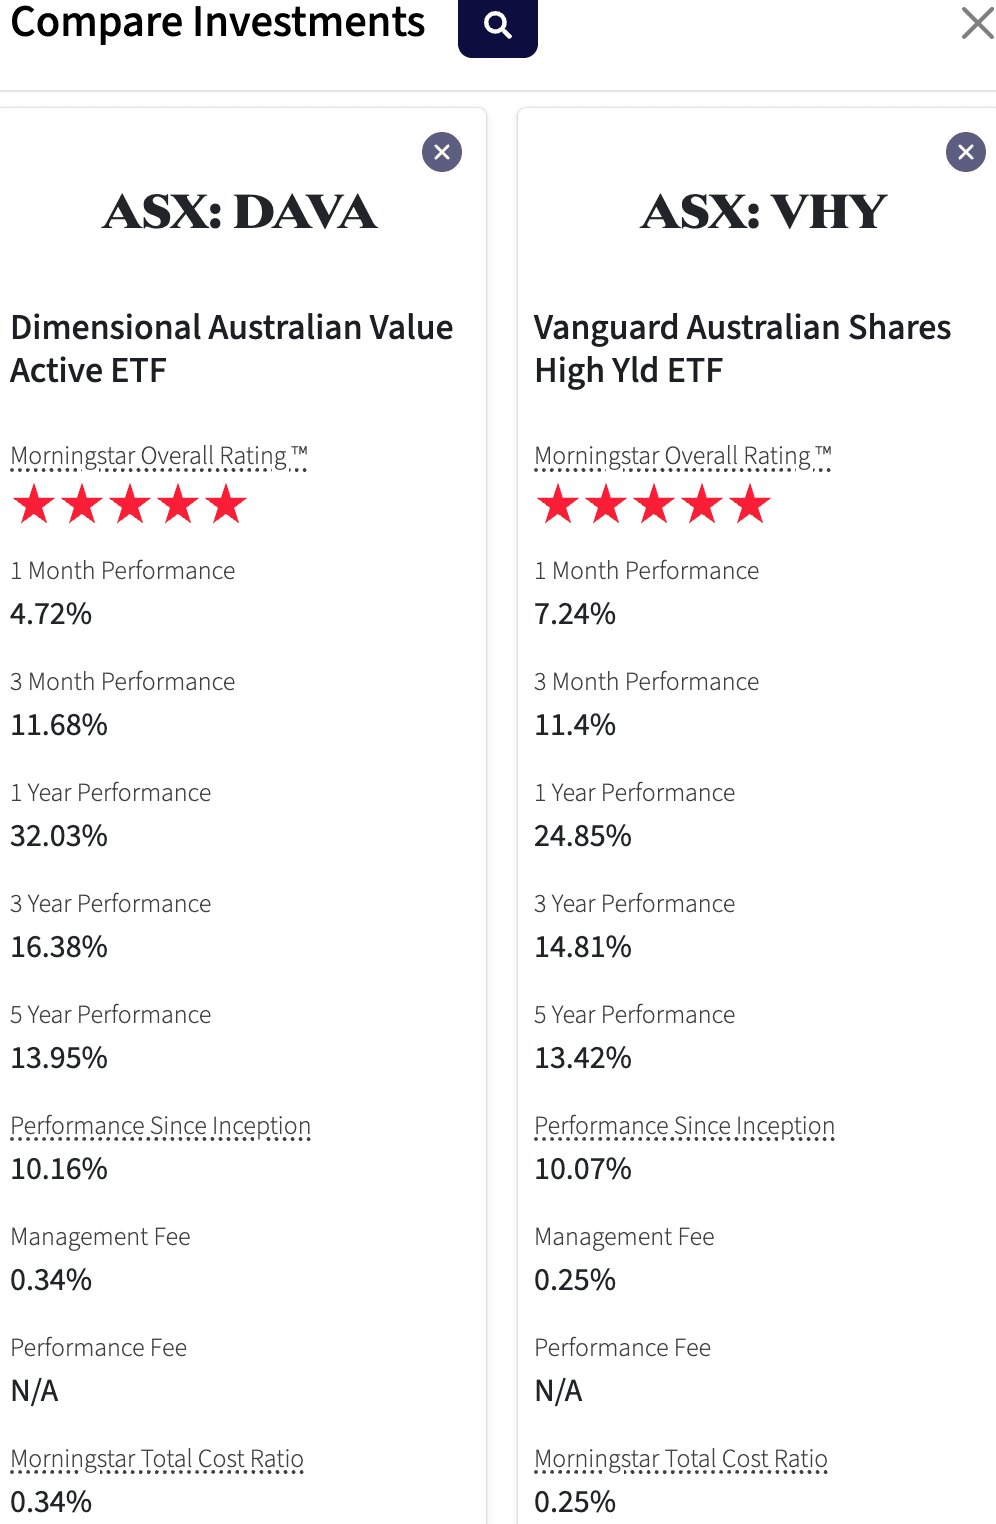
At this point, we’re ready to choose a fund out of the two being compared.
Whilst both are solid picks for this investor, Dimensional Australian Value Active ETF (ASX: DAVA) offers a return profile more aligned with this investor’s objectives. It appears to offer the ideal Australian equity exposure for their portfolio.
But that’s not the end of the process…
Mindset is also a key part of this process. Even with high-quality analysis, investor behaviour can undermine returns.
This is why investors often earn lower returns than the funds they invest in: poor timing.
Common traps to avoid include:
Tip: Follow a disciplined process like this one and stick to it.
The final step is portfolio integration.
Ask yourself:
Effective fund selection is about building a well-constructed portfolio using a repeatable framework.
The best investors:
By applying this framework, you move from reactive investing to disciplined, evidence-based decision making. That shift is where real long-term outperformance begins.
Invest in the largest 300 Australian companies listed on the ASX.
The investment objective of the Fund is to provide long-term capital growth by gaining exposure to a diversified portfolio of Value Companies listed in Australia.
Vanguard Australian Shares High Yield ETF seeks to track the return of the FTSE Australia High Dividend Yield Index before taking into account fees, expenses and tax.
Disclaimer: This article is prepared by Simon Turner. It is for educational purposes only. While all reasonable care has been taken by the author in the preparation of this information, the author and InvestmentMarkets (Aust) Pty. Ltd. as publisher take no responsibility for any actions taken based on information contained herein or for any errors or omissions within it. Interested parties should seek independent professional advice prior to acting on any information presented. Please note past performance is not a reliable indicator of future performance.

-imbv0jwtgfkpzmj55uvm.png)
-m30olkm5wq22fzwf7dyf.png)
-ovpesoiwa1arap1qzn80.png)
-4yb643awg03namrcahu4.png)
-zrxpxihmn0inisejx8wx.png)
-vke5r81en85n0lawxvqo.png)