-9w2h9oz18b9y363ubw7y.png)
How Will This Bull Market End?
We all know that markets move in bull and bear phases while the long-term trend is up.
Of course, every bull market phase ends, at least until the market is cleansed of excess.
The question is: how will this current bull market phase end?
Maybe the best analogy isn’t the dot-com crash or the global financial crisis that the media is so focused on, but the Go-Go Years of the late 1960s…
Key Takeaways
- Markets usually end cycles in one of three ways: a bubble bursting, a credit crisis, or a broad bear market in which the favourite stocks collapse.
- Today’s record concentration, record household share ownership and stretched valuations most closely resemble the late-1960s Go-Go Years.
- In 1969-70 the S&P 500 fell 36% while the era’s glamour stocks fell an average of 81%, a reminder that the real pain can be masked beneath the index.
- Australia had its own Go-Go mania: Poseidon NL shares soared from 80 cents to almost $280 in 1969-70 before collapsing.
- Unlike 1969 or 2000, the largest companies today earn a share of profits broadly in line with their index weight, so this bull market could run further if their earnings keep delivering.
- Australian investors can build resilience by diversifying beyond US mega-caps, reviewing their currency settings and running an honest stress test.
Explore 100s of investment opportunities and find your next hidden gem!
Search and compare a purposely broad range of investments and connect directly with product issuers.
Three Ways A Cycle Can End
So, how do bull markets end?
The two most recent endings remain vivid in most investors’ minds.
When the dot-com bubble burst in 2000, the S&P 500 fell about 50% and the Nasdaq 100 lost more than 80%.
The global financial crisis brought a fall of nearly 60% and a near-collapse of the banking system.
Both analogies are popular right now, the first because AI spending resembles the internet build-out and the second because it was the last true credit cycle.
There’s also a third template that was less dramatic for the index but more brutal for its darlings.
The 1969-70 US recession was mild, with GDP falling only 0.6%, and the market suffered a textbook bear market of 36%. However, the 30 leading glamour stocks compiled at the time by consultant Max Shapiro fell an average of 81%, according to John Brooks’ history The Go-Go Years.
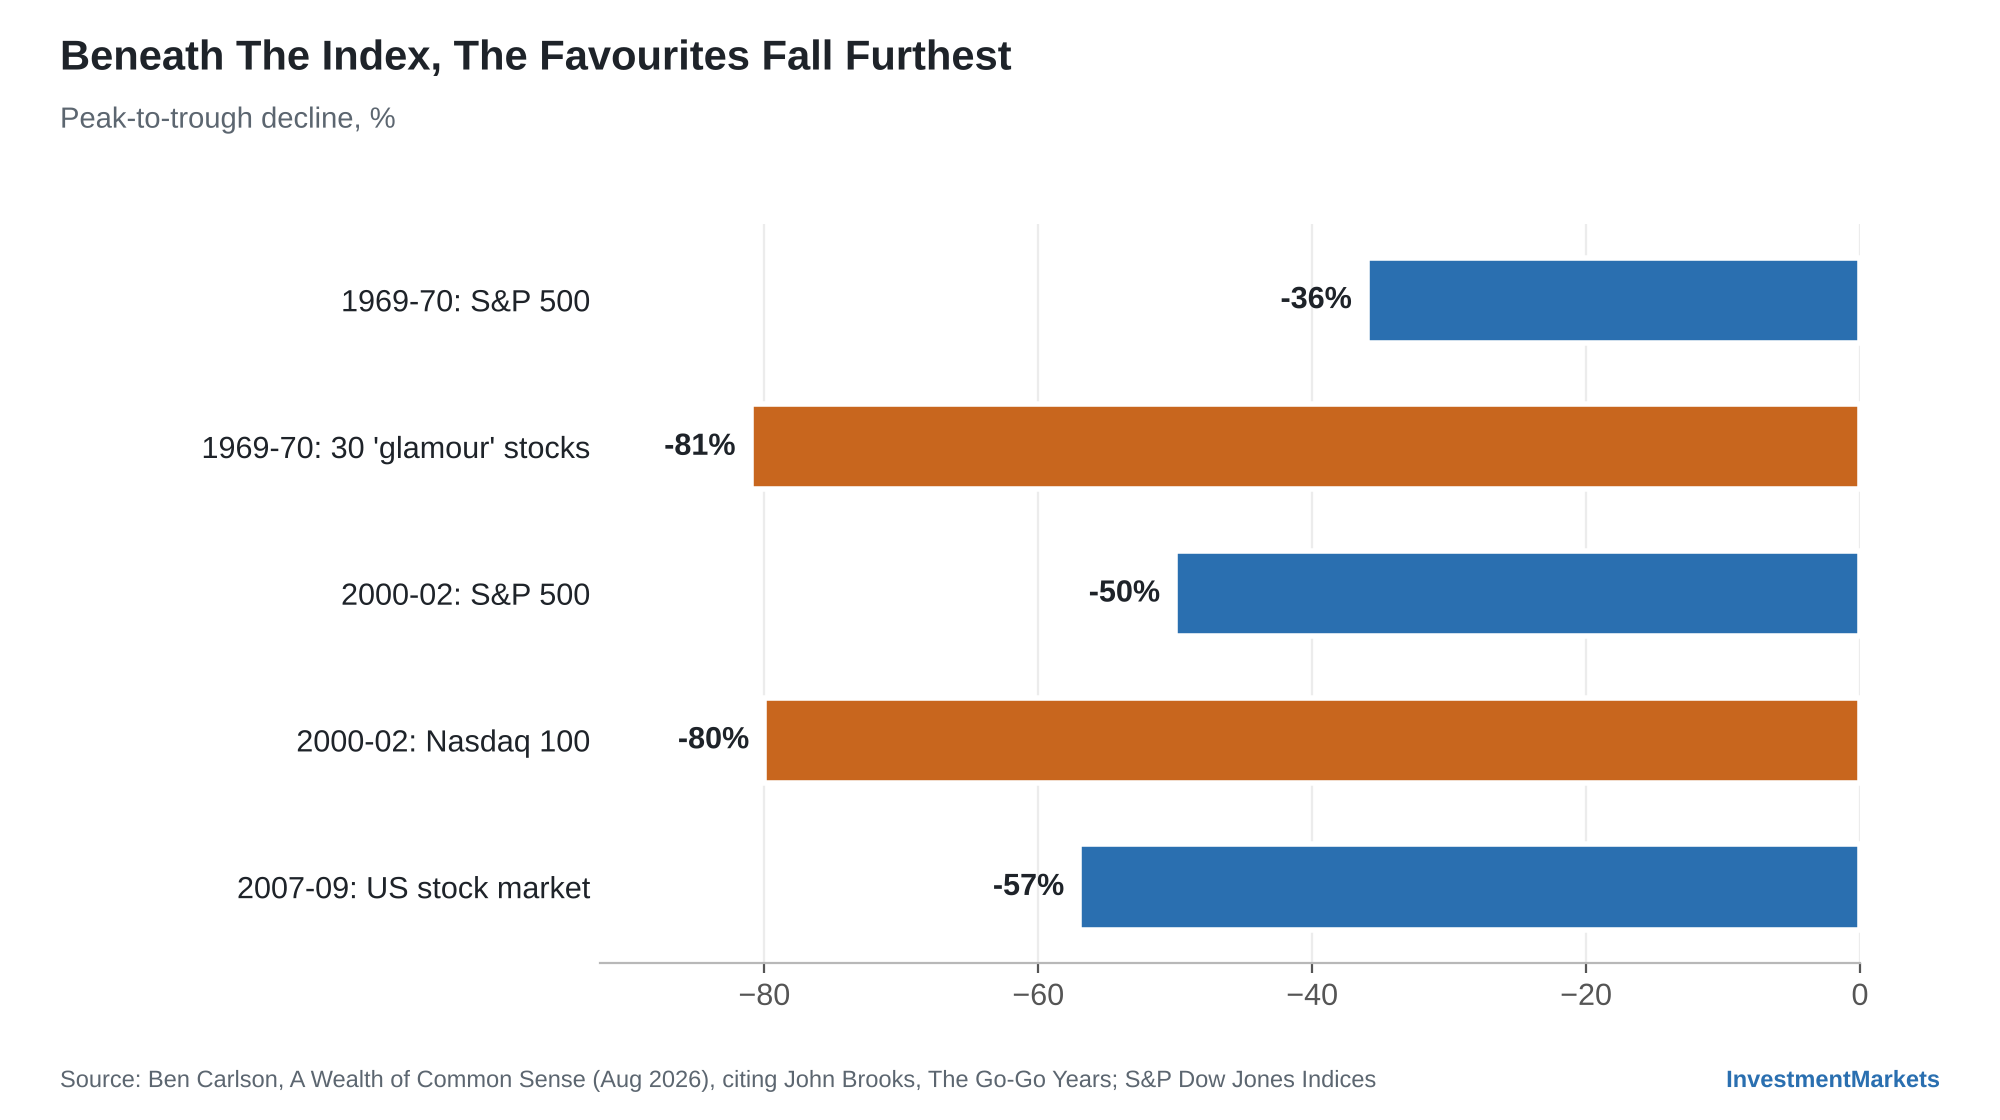
Source: A Wealth of Common Sense, citing John Brooks, The Go-Go Years
Why The Go-Go Analogy May Fit Today’s Markets
The 1960s were defined by speculation, surging retail participation, rapid technological change and ‘one-decision’ growth stocks that investors felt they could buy and never sell.
It was also the age of the celebrity fund manager. Gerald Tsai built his name trading glamour stocks at Fidelity before leaving in the mid-1960s to launch his own Manhattan Fund, only to be crushed in the 1968-70 bear market when momentum stocks collapsed.
It was a genuinely mass market. According to John Brooks, 31 million Americans owned shares by 1970, compared with four or five million in 1929, so the dollar losses of 1969-70 were some ten times those of the 1929-30 crash.
Australia had its own equivalent Go-Go moment. In September 1969, nickel explorer Poseidon NL reported a discovery at Mount Windarra in Western Australia, and its shares rocketed from 80 cents to almost $280 by February 1970. At the height of the frenzy, the Sydney Stock Exchange was trading more shares by volume than Wall Street.
The hangover was brutal. Ten months after the peak, Poseidon traded at about $39. By 1976, the shares were worth just 38 cents.
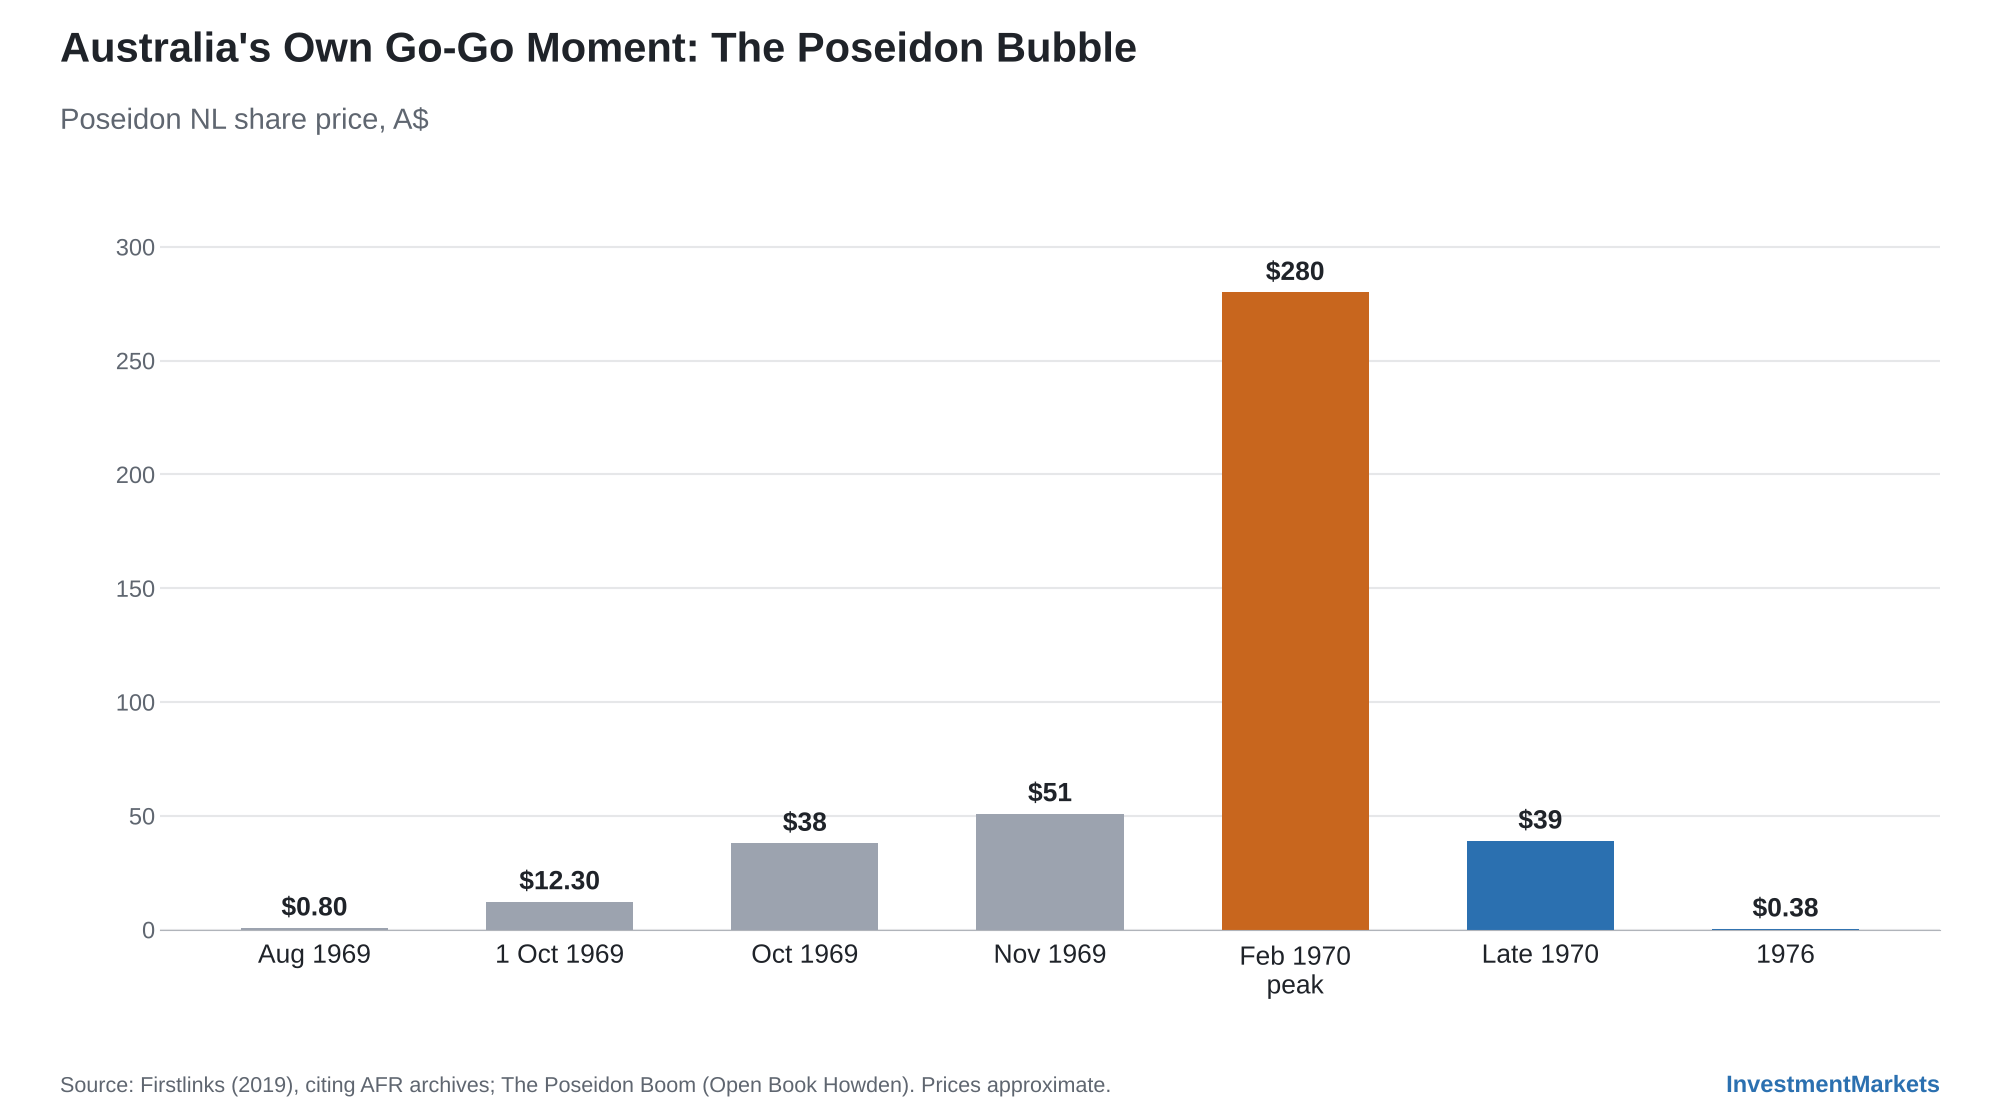
Source: Firstlinks, citing AFR archives; The Poseidon Boom
Swap the Go-Go era’s glamour stocks, and the ‘Nifty Fifty’ that inherited their mantle in the early 1970s, for the Magnificent Seven and the parallels are hard to miss.
Look at the present-day market structure. Concentration is at extremes. The top 10 stocks represented a record 40.7% of the S&P 500 at the end of 2025 and 39% at present, against 22% at the height of the Nifty Fifty and 27% at the dot-com peak.
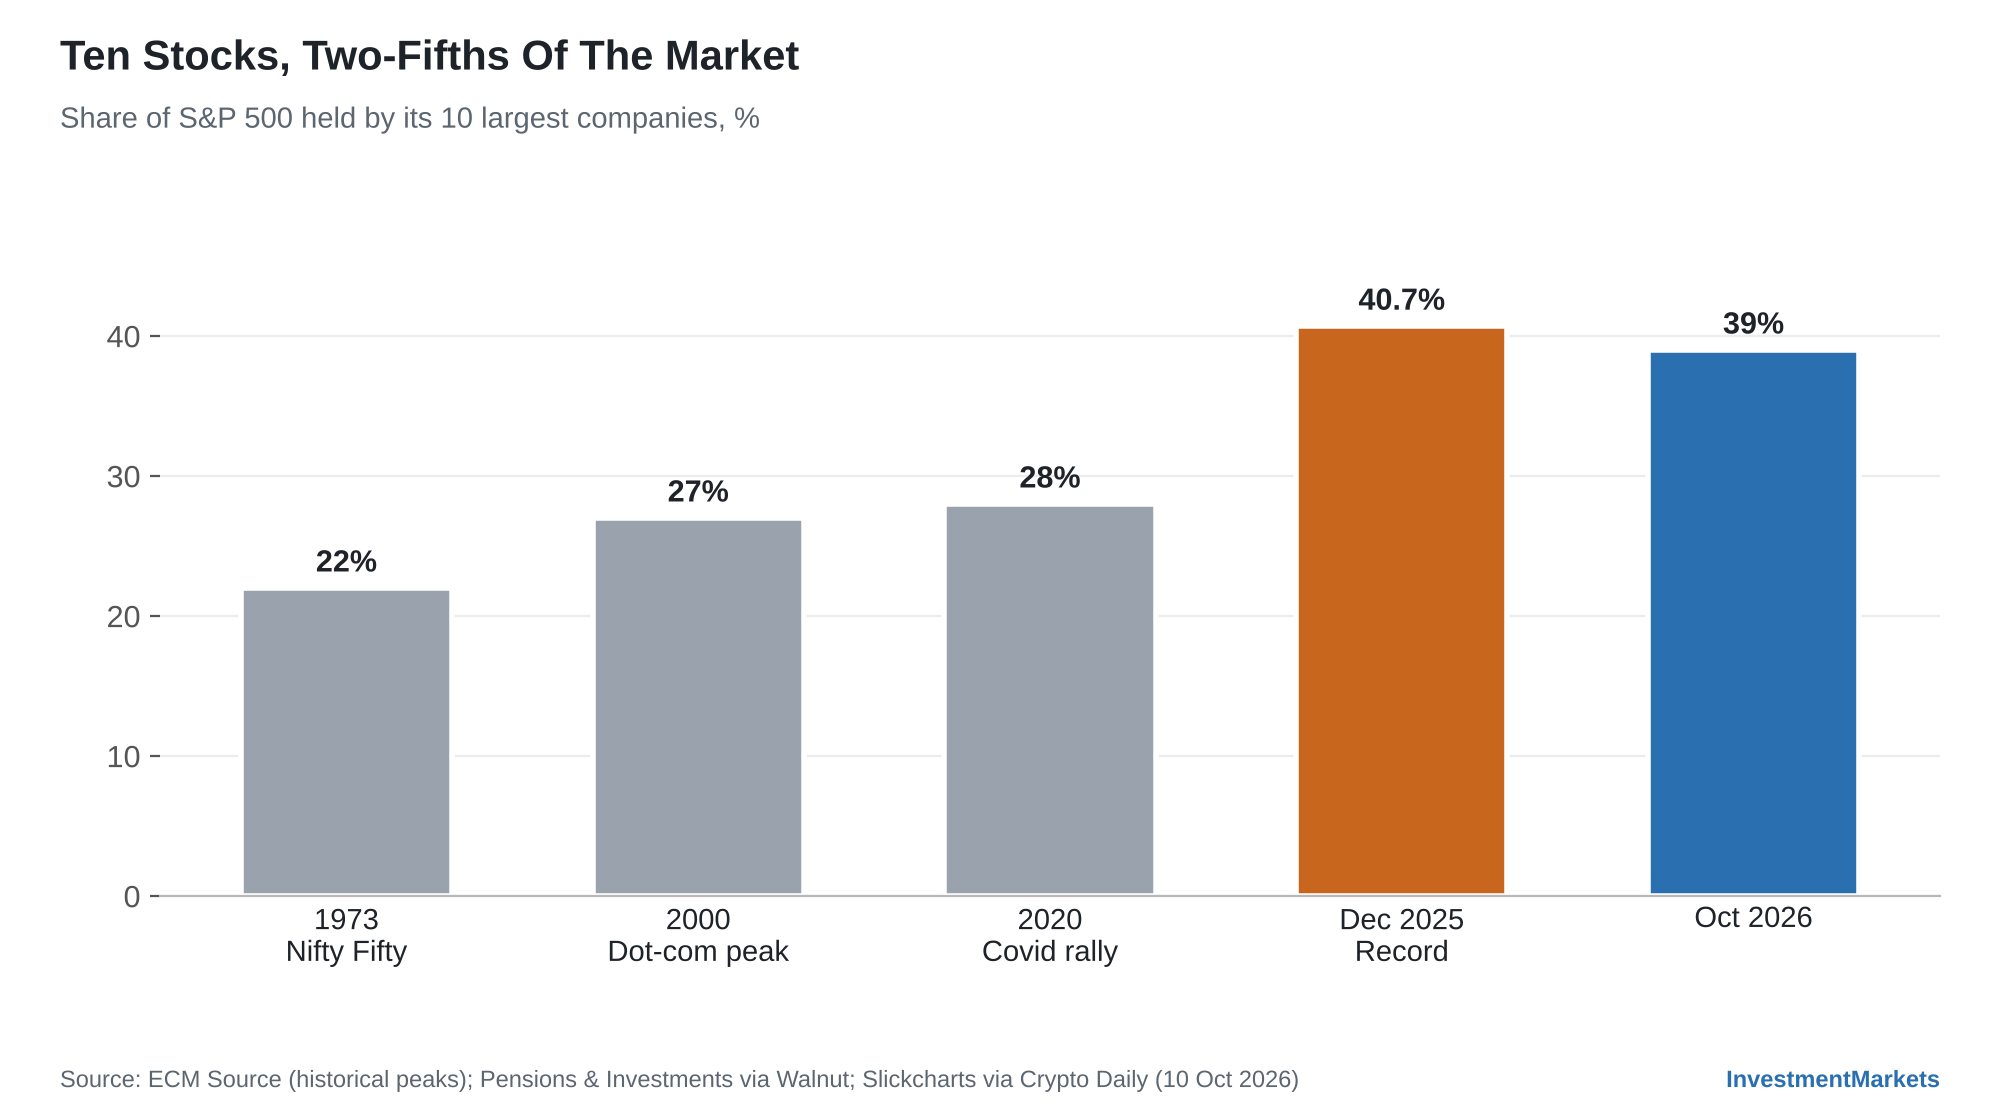
Source: ECM Source, Walnut, Crypto Daily/Slickcharts
Participation is at extremes too. Equities reached a record 47.1% of US household financial assets in late 2025, well above the 38.7% peak of 2000.
The risk with this state of affairs is that the more people own equities, the more painful the same percentage loss becomes. That’s even truer now than in the sixties, because portfolios are larger than ever.
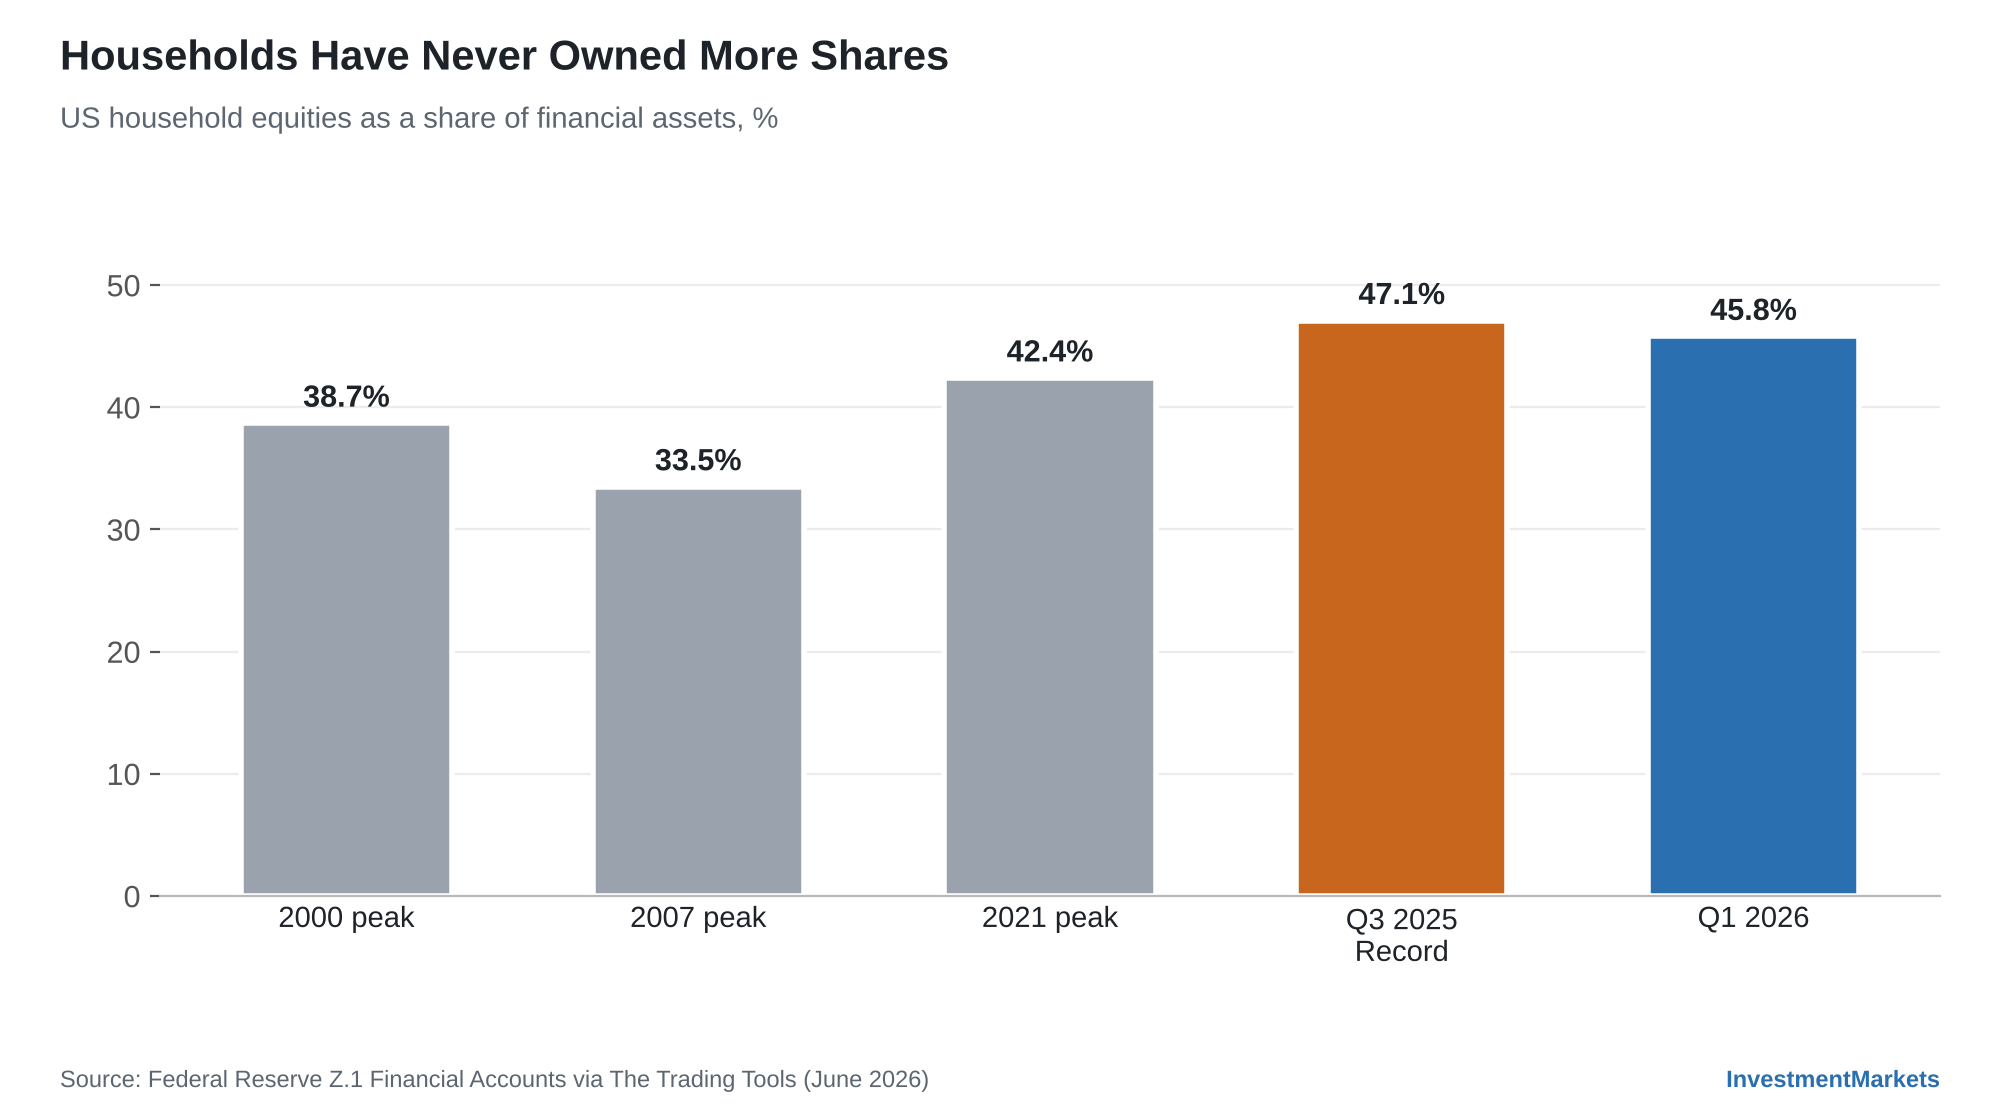
Source: The Trading Tools, Federal Reserve Z.1 Financial Accounts
Australian investors are in the same boat.
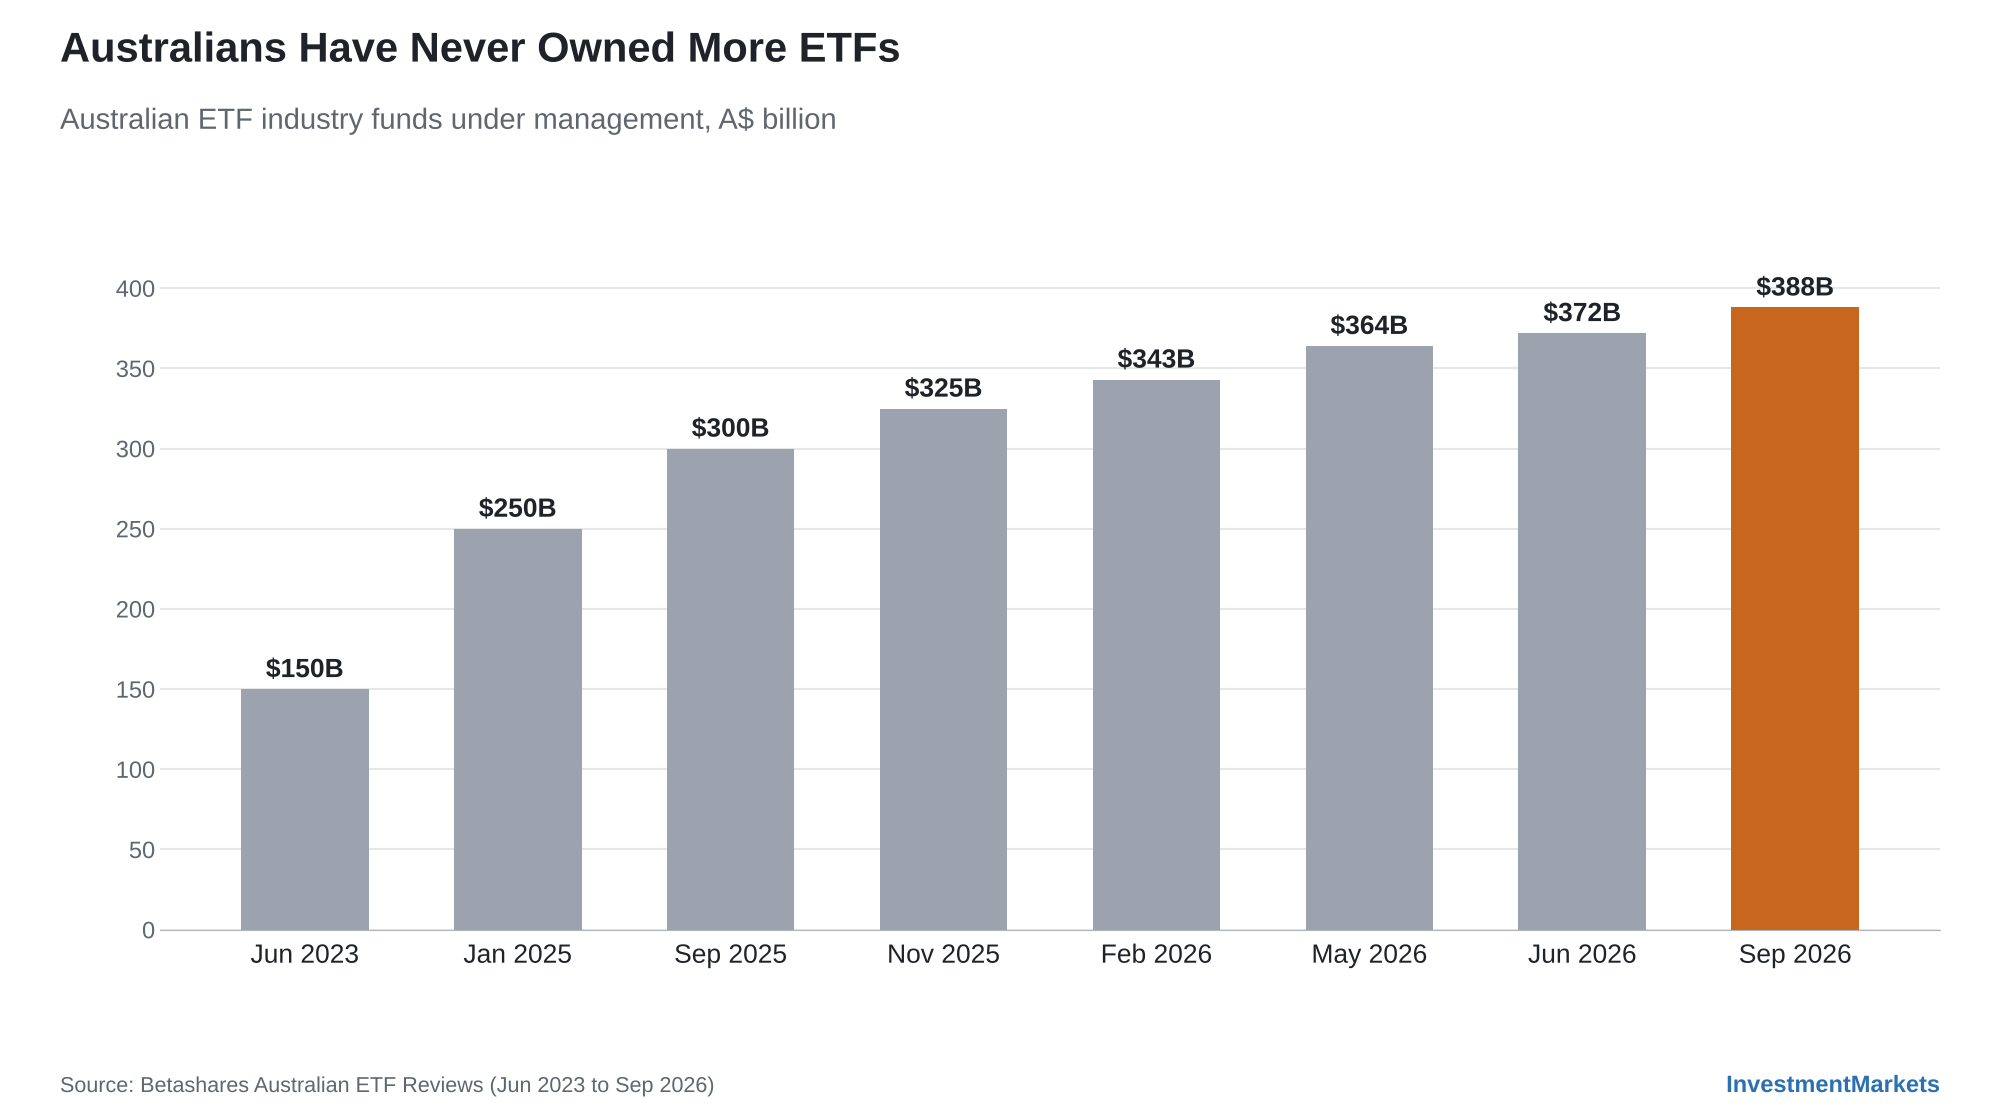
The local ETF industry reached a record A$388 billion in funds under management in September 2026, up from A$150 billion in mid-2023, and international equities drew 46% of that month’s inflows.
Much of that money ends up in the same handful of US giants: the Magnificent Seven make up 25% of the MSCI World Index (as at September 2026), so seemingly diversified global ETFs now carry meaningful concentration risk.
Backward-looking valuations are also stretched. The Shiller CAPE stands at 41.1, close to its 1999 peak of 44.2 and more than double its long-run average of 17.4.
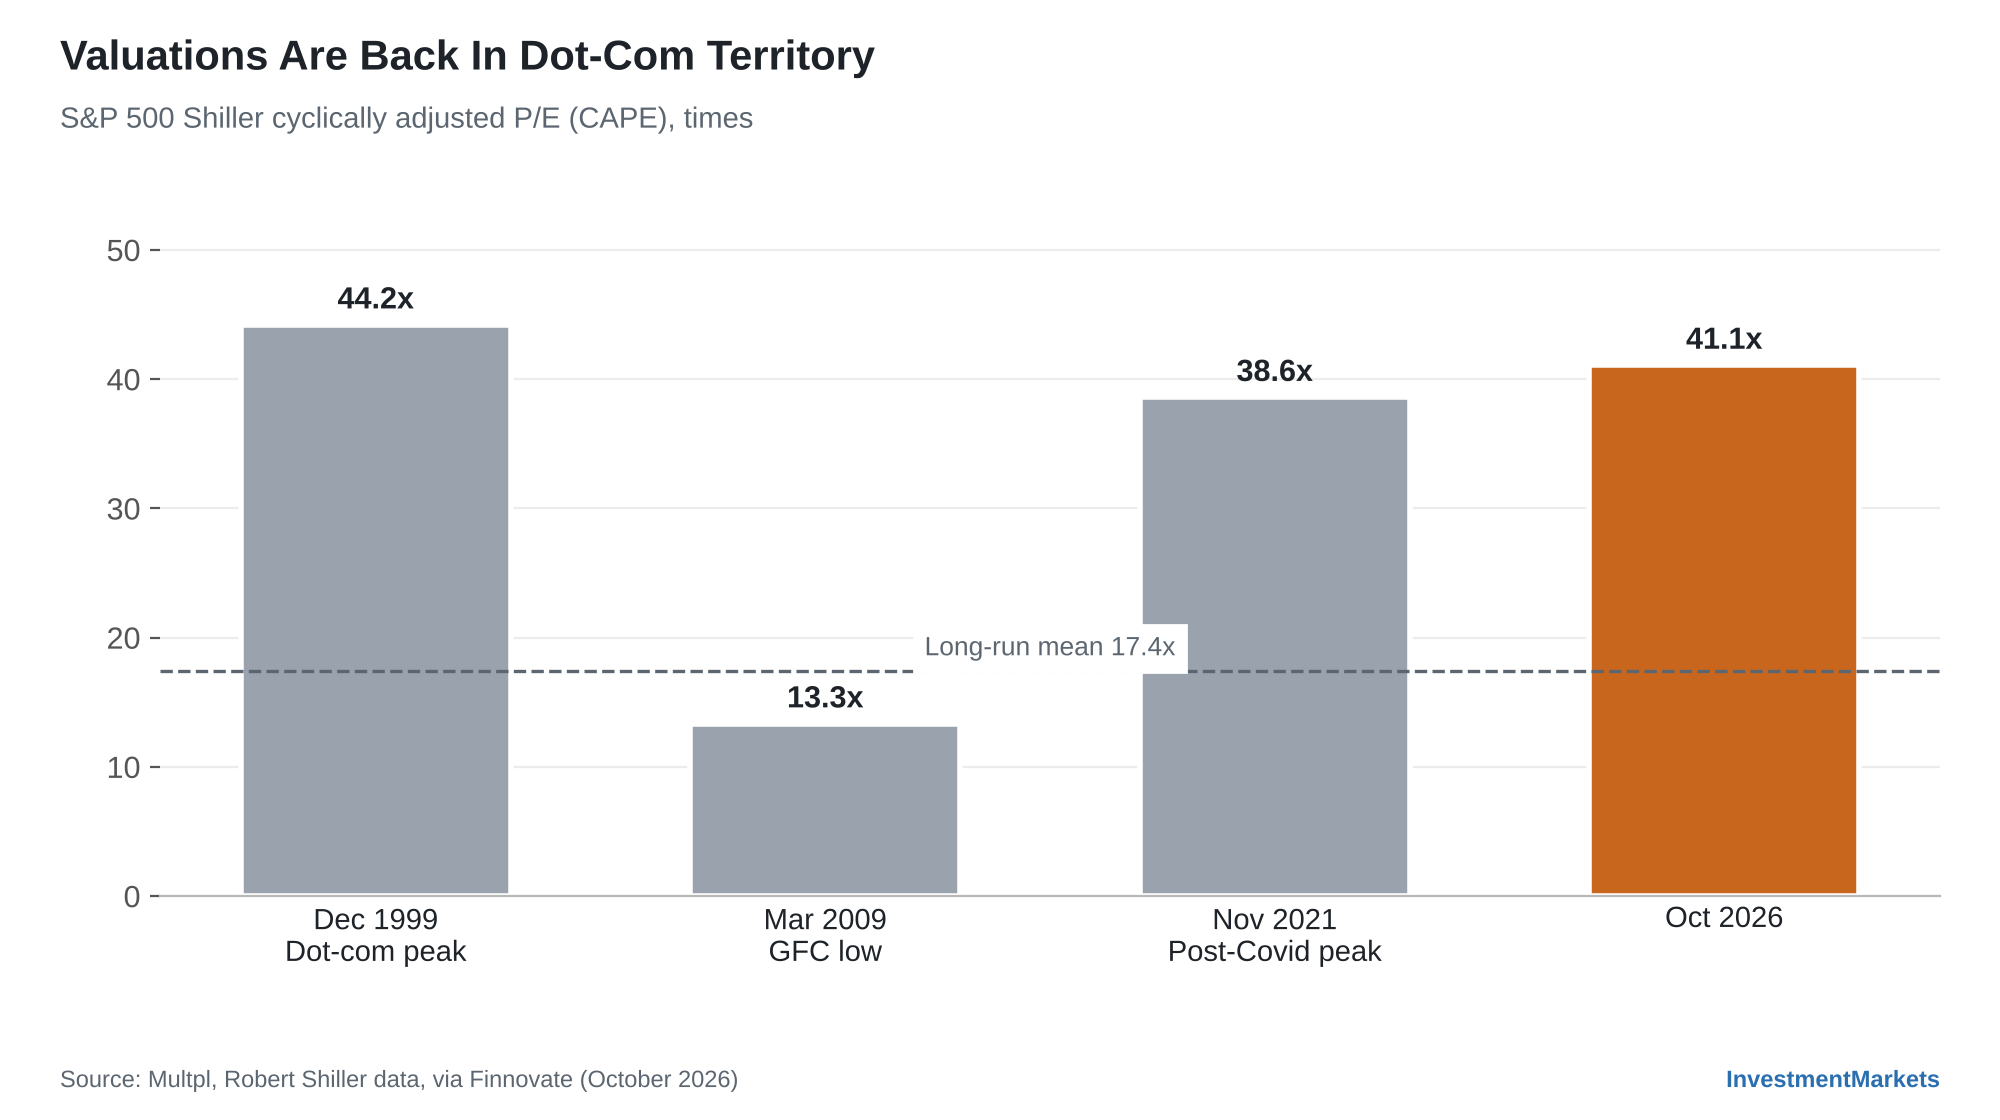
Source: Finnovate, Multpl, Robert Shiller data
The S&P 500 has never delivered a positive three-year return after a monthly CAPE reading above 40, though that rests on a small sample from a single episode. Moreover, focusing on the Shiller CAPE ratio presumes that backward-looking earnings measures are still relevant in today’s fast-changing world. That’s surely debatable as the AI rollout accelerates.
The underlying historical lesson is that if this cycle does end like the Go-Go Years, the pain underneath the surface could be worse than the headline index decline suggests.
Subscribe to InvestmentMarkets for weekly investment insights and opportunities and get content like this straight into your inbox.
Differences & Similarities
There’s one major difference between today and 1969: today’s market leaders are enormously profitable.
The 10 largest S&P 500 companies earn roughly the same share of index net income as their share of index weight, about 38%.
In dollar terms, that’s US$1 trillion of the index’s US$2.7 trillion in trailing 12-month net income. Importantly, their share of profits has climbed from 21% in 2019 to 38% today, keeping pace with their rising market weight.
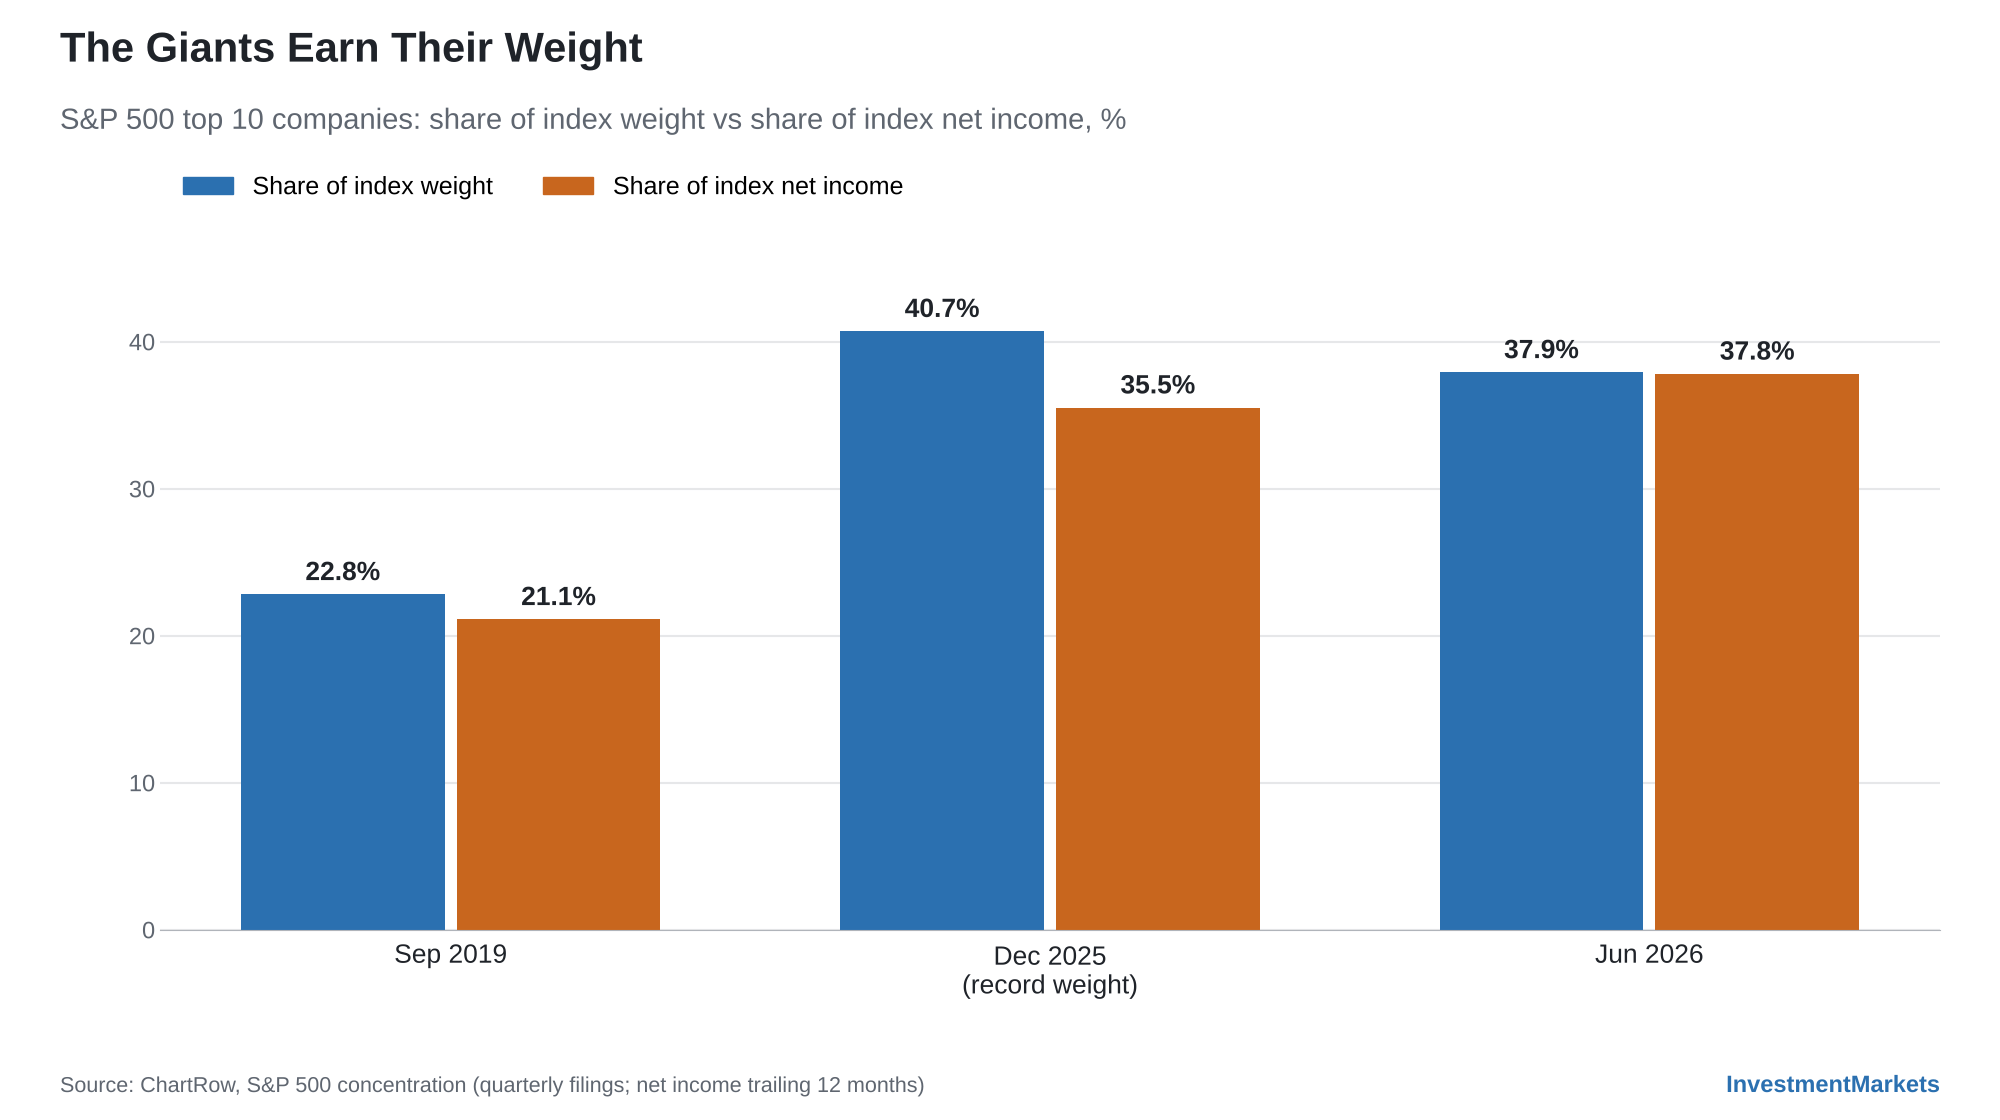
Source: ChartRow, S&P 500 concentration data
That was not true of many 1960s conglomerates or 1999 dot-coms.
Earnings valuations are also much less extreme than at past peaks.
At the end of 1972, the Nifty Fifty traded on an average of 41.9 times earnings, more than double the S&P 500’s 18.9 times. In September 2026, the Magnificent Seven traded at an average of 27 earnings, against 20 times for the index.
On Morgan Stanley Wealth Management’s numbers, the group’s valuation premium over the other 493 S&P 500 companies has shrunk to 10%, its narrowest in more than a decade.
Nvidia, for example, trades at 18 times forward earnings, roughly half its historical average of 36 times.
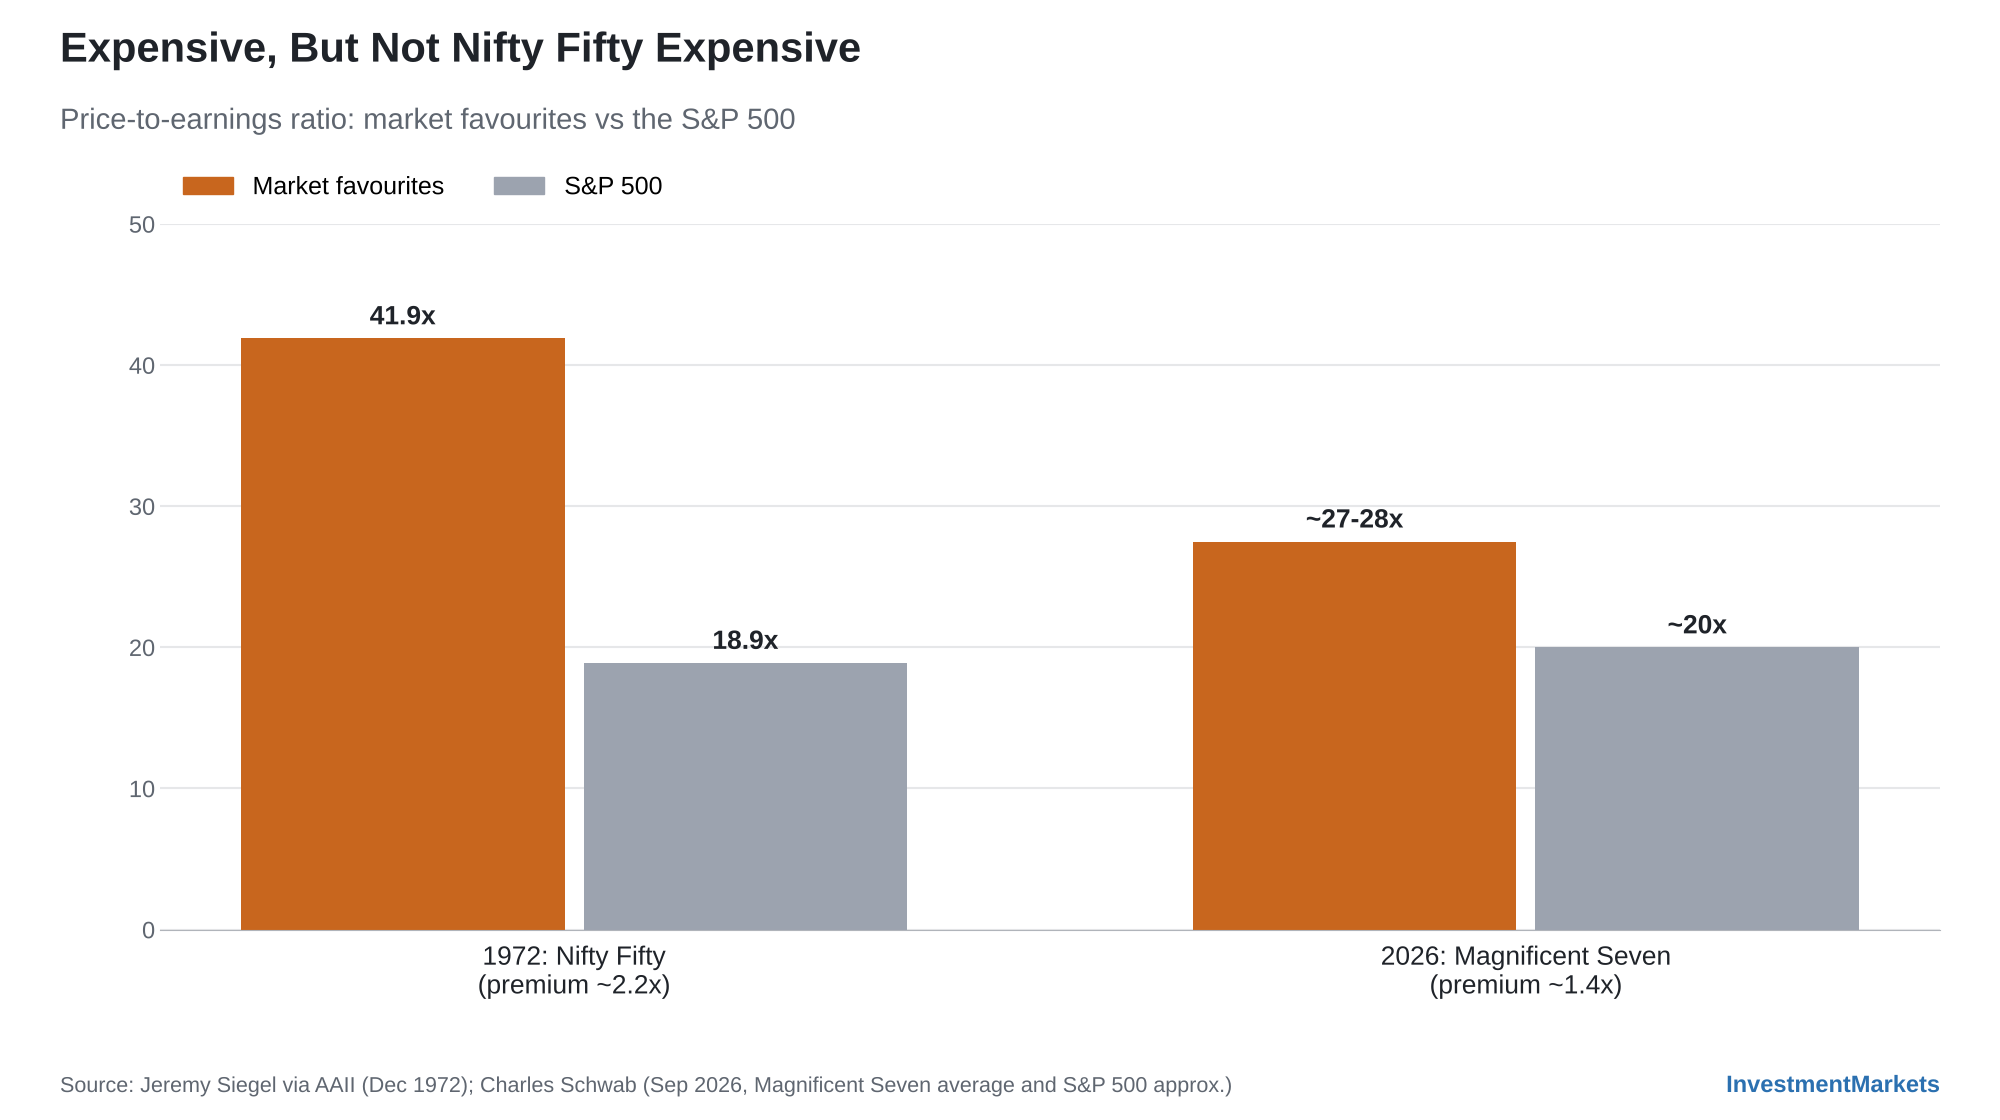
Source: AAII, citing Jeremy Siegel; Charles Schwab
Still, when GQG Partners compared today’s leaders with the Nifty Fifty in its paper Go-Go Gone, it found the Nifty Fifty’s earnings kept growing after 1973 even as their share prices slumped.
Its verdict is worth remembering:
“Trusting the companies turned out to be wise, trusting their valuations did not.” — GQG Partners
Balance sheets are also far stronger than in the Go-Go era, when many conglomerates were assembled with debt and richly priced shares.
The Magnificent Seven held an estimated US$600 billion in cash and marketable securities at their 2025 annual filings, and S&P Global Ratings has said it does not expect Alphabet, Amazon or Meta’s debt-to-EBITDA ratios to exceed 0.5 times in 2026 or 2027.
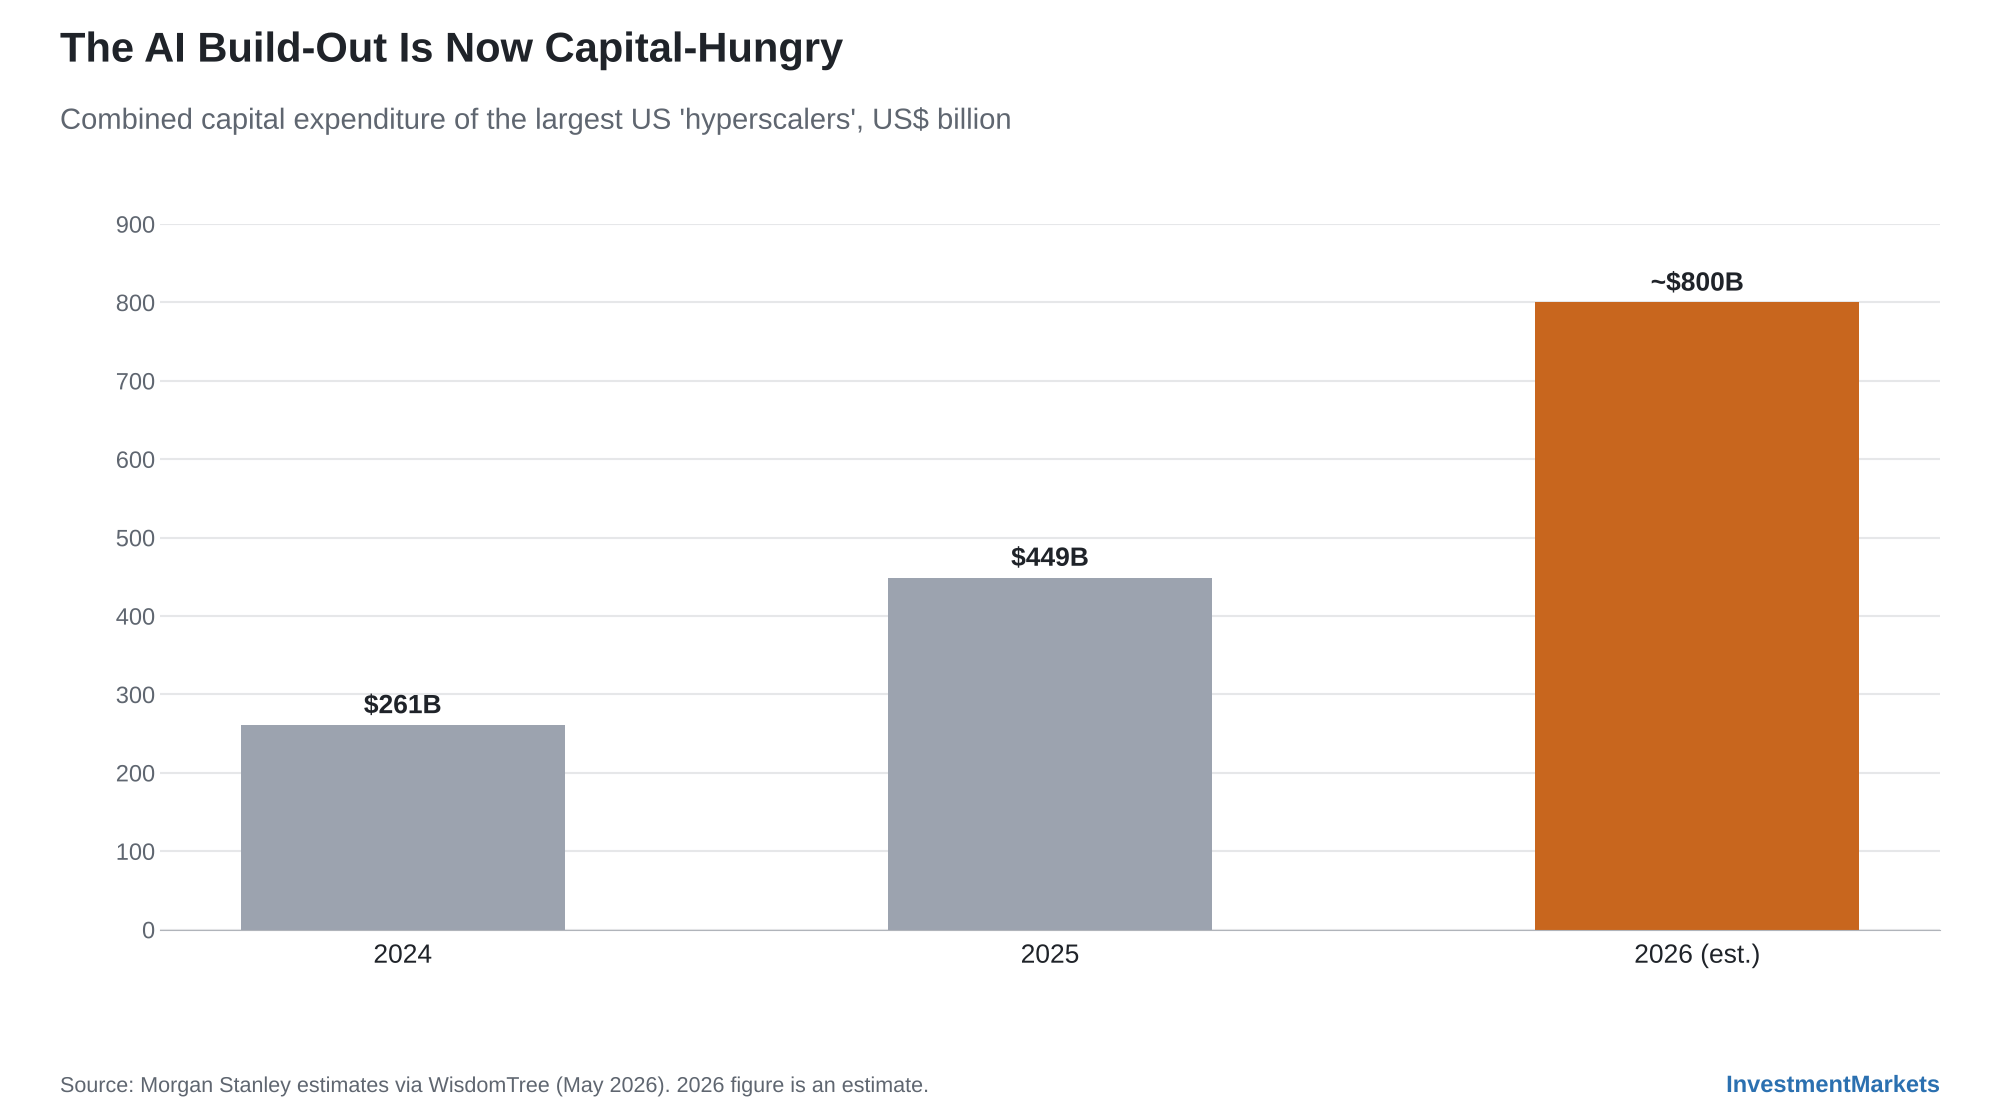
That cushion is now being spent on the AI infrastructure rollout.
Morgan Stanley estimates the hyperscalers’ combined capital expenditure is approaching US$800 billion in 2026, up from US$261 billion in 2024.
As a result, AJ Bell found the group’s free cash flow has fallen to 7.9% of quarterly sales, while their net cash piles are shrinking and buybacks are drying up.
Source: WisdomTree, citing Morgan Stanley estimates
Could The Giants Keep Growing & The Bull Market Run On?
It’s entirely possible that this bull market keeps running.
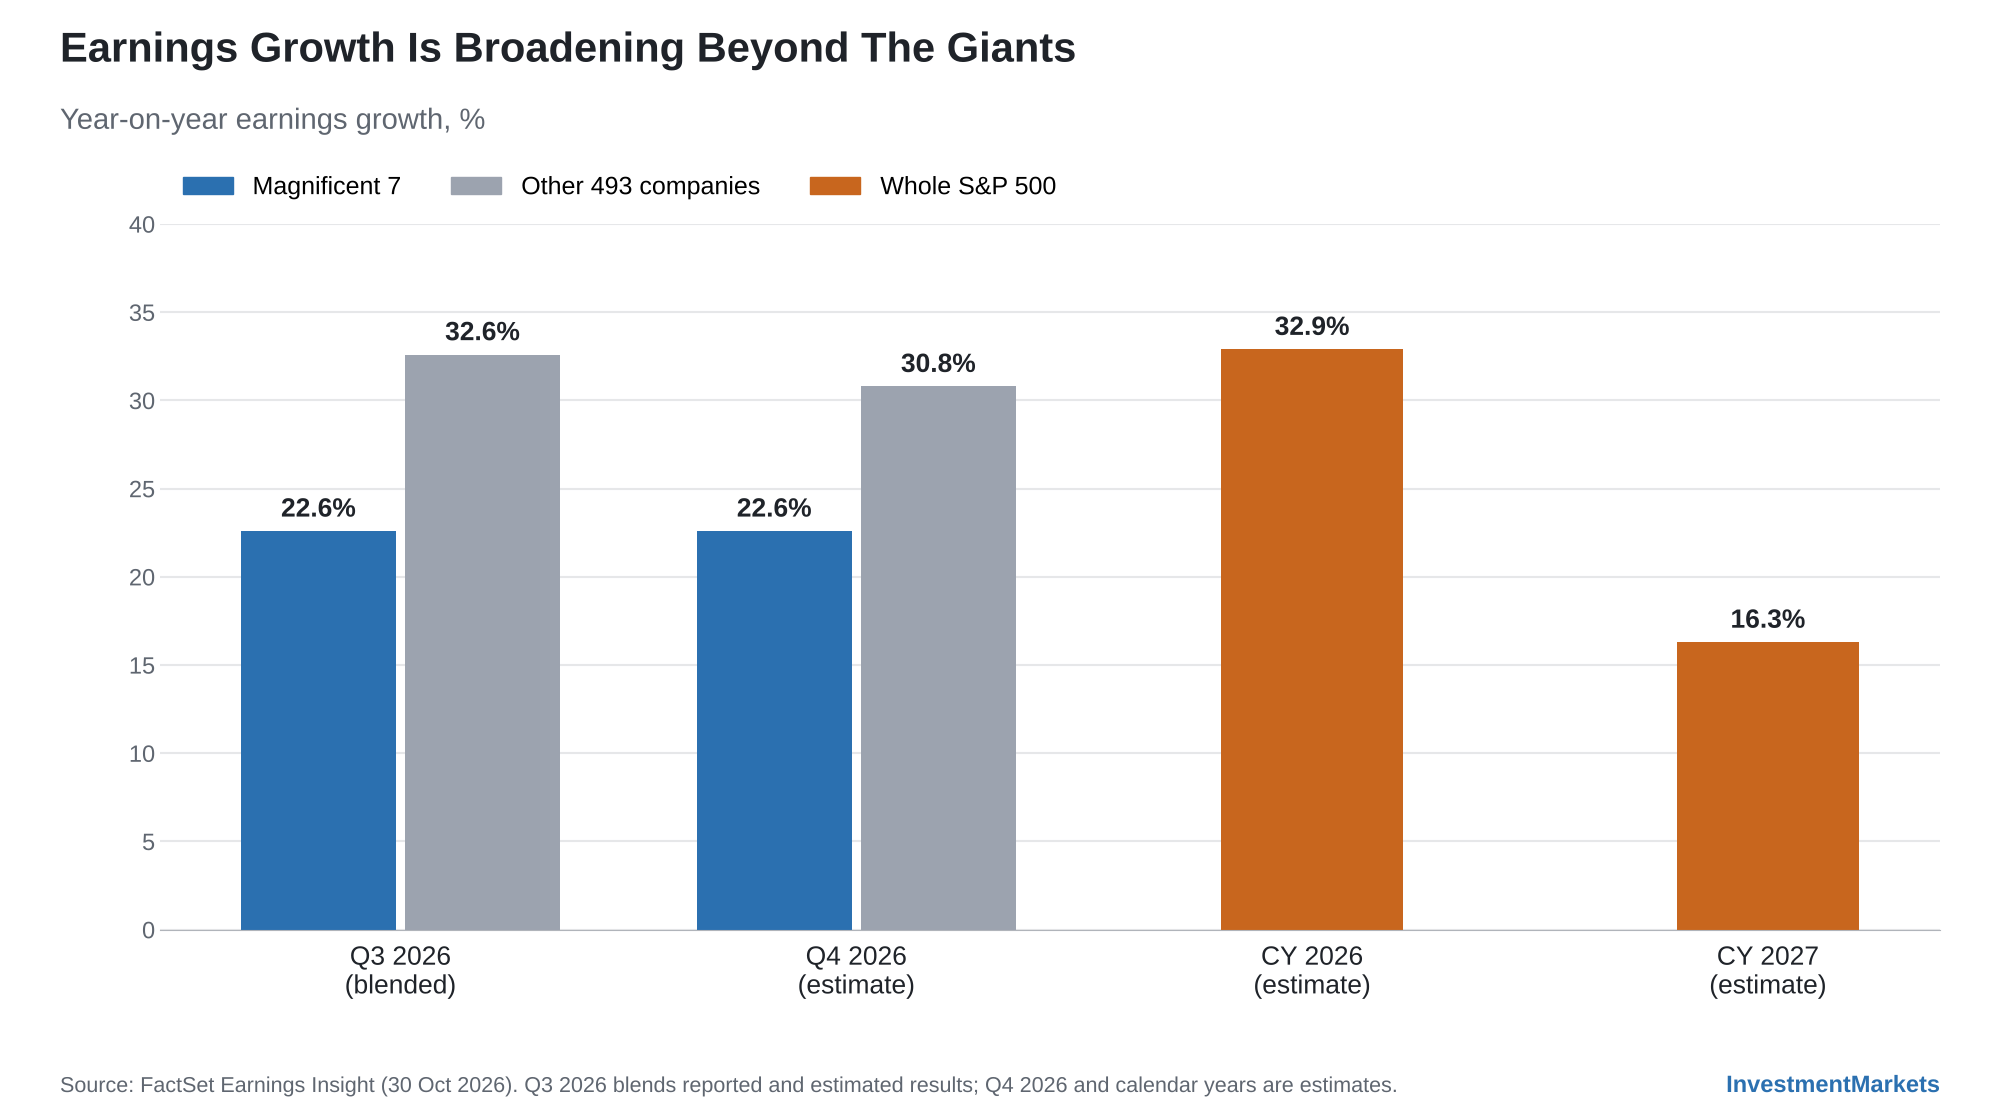
Unlike in the late 1960s, it is being powered by surging profits rather than just rising multiples. Analysts expect S&P 500 earnings to grow 32.9% in 2026 and a further 16.3% in 2027, according to FactSet.
Because profits have risen so quickly, the index’s forward P/E of 18.7 is below its 10-year average of 19.1, even though the backward-looking Shiller CAPE sits above 40.
The Magnificent Seven already account for 34.9% of the S&P 500, with a combined value of US$24.6 trillion. If the AI build-out meets investors’ expectations, their share of the index could keep rising without ending this bull market.
There are also signs that leadership is broadening, which supports the longer-term bull market case.
FactSet’s blended figures show the Magnificent Seven grew Q3 2026 earnings by 22.6%, behind the 32.6% delivered by the other 493 companies. Analysts expect the same pattern in Q4.
The risk is that the giants’ growth is narrowly sourced. Before the Q3 reporting season, FactSet estimated that without Nvidia and Meta, the remaining five members’ earnings growth would fall to 7.5%.
Source: FactSet Earnings Insight, 30 October 2026
In other words, this bull market could keep going even while its leadership changes.
On a less bullish note, the macro backdrop does look decidedly like 1969.
The Federal Reserve raised rates in September to 3.75% to 4.00%, its first hike since 2023. Brent crude is near US$112 a barrel, up about 90% this year. The US Treasury even doubled its long-bond buybacks in August after the 30-year yield hit a 19-year high.
Rising inflation and rising rates were precisely the conditions that ended the Go-Go Years, and long-duration growth stocks are the assets most sensitive to them.
Investment Implications
If the next bear market resembles 1969-70, the index may fall a normal amount while many of its former favourites may fall much further.
How can investors prepare for that scenario?
Value and international exposures could reduce reliance on those favourites, through options such as the Vanguard Global Value Equity Active ETF (VVLU), the Vanguard All-World ex-US Shares ETF (VEU) or active ETFs with a valuation discipline.
Valuations outside the US offer a useful starting point. At the end of June, the cyclically adjusted P/E for global markets excluding the US was about 21, roughly half the US reading.
So, the arguments in favour of diversifying globally, away from the US, are currently compelling.
Defensive assets also appear well-positioned to navigate this scenario. With the RBA cash rate at its highest since 2011, bond fund ETFs and cash ETFs now offer yields above core inflation while investors wait.
Prepare To Finish The Race
In summary, nobody knows when this cycle will end. Trying to predict it may well be a fool’s errand. But it will end one day. Market crashes are the equivalent of the occasional short-term subscription fee required to generate solid long-term returns.
What history does offer is a range of potential endings, and the Go-Go Years of the sixties deserve a place in that range because today’s concentration, participation and valuations echo them so closely.
The main takeaway is to ensure your portfolio’s future success doesn’t depend on the market’s favourites remaining in favour.
At this stage, savvy investors are focusing their mental energy on ensuring their portfolios’ concentration risk is contained and their diversification is real, rebalancing toward their targets, and holding a portion of defensive assets they won’t need to sell in a downturn.
They are readying themselves in advance to keep paying the market’s subscription fee without being forced out at an unfavourable moment.
Frequently Asked Questions
What Were The Go-Go Years?
The Go-Go Years were the speculative US bull market of the mid-to-late 1960s, marked by heavy retail participation, conglomerates and glamour growth stocks. They ended with the 1969-70 bear market, in which many favourites lost around 80% of their value.
Is The US Stock Market In A Bubble?
Valuations are close to dot-com levels on the Shiller CAPE and concentration is at records, but today’s largest companies are highly profitable. Elevated valuations point to lower long-term returns rather than a precise timing signal.
Could This Bull Market Keep Going?
Yes. S&P 500 earnings are forecast to grow 32.9% in 2026 and 16.3% in 2027, and the forward P/E of 18.7 is below its 10-year average. The main risks are disappointing returns on AI spending and rising inflation and interest rates.
Are The Magnificent Seven Overvalued?
They trade at around 27 to 28 times earnings, a premium to the S&P 500 but well below the Nifty Fifty’s 41.9 times in 1972. Their profits are real, but heavy AI spending is squeezing free cash flow.
What Was Australia’s Poseidon Bubble?
The Poseidon bubble was Australia’s version of the late-1960s mania. Nickel explorer Poseidon NL’s shares soared from 80 cents in 1969 to almost $280 in February 1970 after a Western Australian nickel discovery, then collapsed to 38 cents by 1976.
How Can Australian Investors Reduce Their US Concentration Risk?
Options include adding ex-US, equal-weight or value exposures, using active managers with a valuation discipline, and holding more defensive assets. Reviewing look-through holdings across all funds is the essential first step.
Should I Move To Cash Before A Crash?
Few investors are able to time crashes, and missing the subsequent recoveries tends to be costly. A more reliable approach is a target asset allocation, regular rebalancing and enough cash or bonds to avoid selling shares in a downturn.
Disclaimer: This article is prepared by Simon Turner. It is for educational purposes only. While all reasonable care has been taken by the author in the preparation of this information, the author and InvestmentMarkets (Aust) Pty. Ltd. as publisher take no responsibility for any actions taken based on information contained herein or for any errors or omissions within it. Interested parties should seek independent professional advice prior to acting on any information presented. Please note past performance is not a reliable indicator of future performance.
Author

Simon Turner
Head of Content (CFA), InvestmentMarkets
Related Articles
-8vp7vkl6lrlbdlb7l4yg.png)
-kxlueh4dd6evxs8gumtc.png)
Investments You May Like

Global X Gold Bullion (Currency Hedged) ETF (ASX: GHLD)
The Global X Gold Bullion (Currency Hedged) ETF (GHLD) offers a simple and cost-effective way to invest in physical gold with currency hedging.
Categories
Recent Articles
View all articles-0xx59tid6lwcl8n1yune.png)
-fhj5k3hgisum3hd4zzq3.png)
-9kk4g7cq08gxnxeroenz.png)