-j3xsi8fignuf9umbuw1u.png)
Are Markets Different This Time? What Has Changed & What Never Does
In September 1969, a little-known Western Australian explorer called Poseidon reported a nickel discovery at Mount Windarra, near Laverton. Its shares rocketed from 80 cents in August 1969 to $280 by February 1970. The world was short of nickel, or so the story went. By April 1970, the share price had slumped to $72, and the original Poseidon was delisted in 1976.
Fifty-seven years on, investors face similar tests of their ability to tell an opportunity from a trap.
- Ten companies now make up around two-fifths of America’s S&P 500.
- Commonwealth Bank trades on a valuation multiple more typical of a fast-growing tech company than a bank.
- AI, we’re told, has rewritten the rules of investing.
So, is it really different this time? Or is that still the most dangerous phrase in finance?
Understanding which parts of the market change, and which never do, is one of the few edges left to investors.
39% Top ten stocks’ share of the S&P 500 (October 2026) |
| 63.4% Top 20 stocks’ share of the S&P/ASX 200 (June 2026) |
| ~71% US share of the MSCI World Index (August 2026) |
| 0.03% Lowest annual fee on an Australian share index ETF |
Key Takeaways
- Market structure has changed enormously. Costs, access, information and the companies inside the index bear little resemblance to those of the past.
- Investor behaviour has not changed. Morningstar’s latest study found the average US fund investor gave up 12% of their funds’ returns to poor timing over the decade to 2025. Australians did better but still lost 7% in the five years to June 2023.
- Most active managers still lag their benchmarks. Over the 15 years to June 2026, 89% of Australian general equity funds and 96% of global equity funds underperformed.
- The most durable edge lies in low costs, genuine global diversification and disciplined behaviour, not in predicting the future.
Templeton’s Warning Was About People, Not Markets
In his 1993 ‘16 Rules for Investment Success’, Sir John Templeton described ‘this time is different’ as among the four most costly words in the annals of investing.
Templeton was warning investors against repeating old mistakes, not claiming that markets stand still.
The evolution of the S&P 500 since 1960 illustrates his point. In 1960, the index comprised 425 industrials, 25 railways and 50 utilities. Today, it spans 11 sectors, and technology dwarfs every other sector by value.
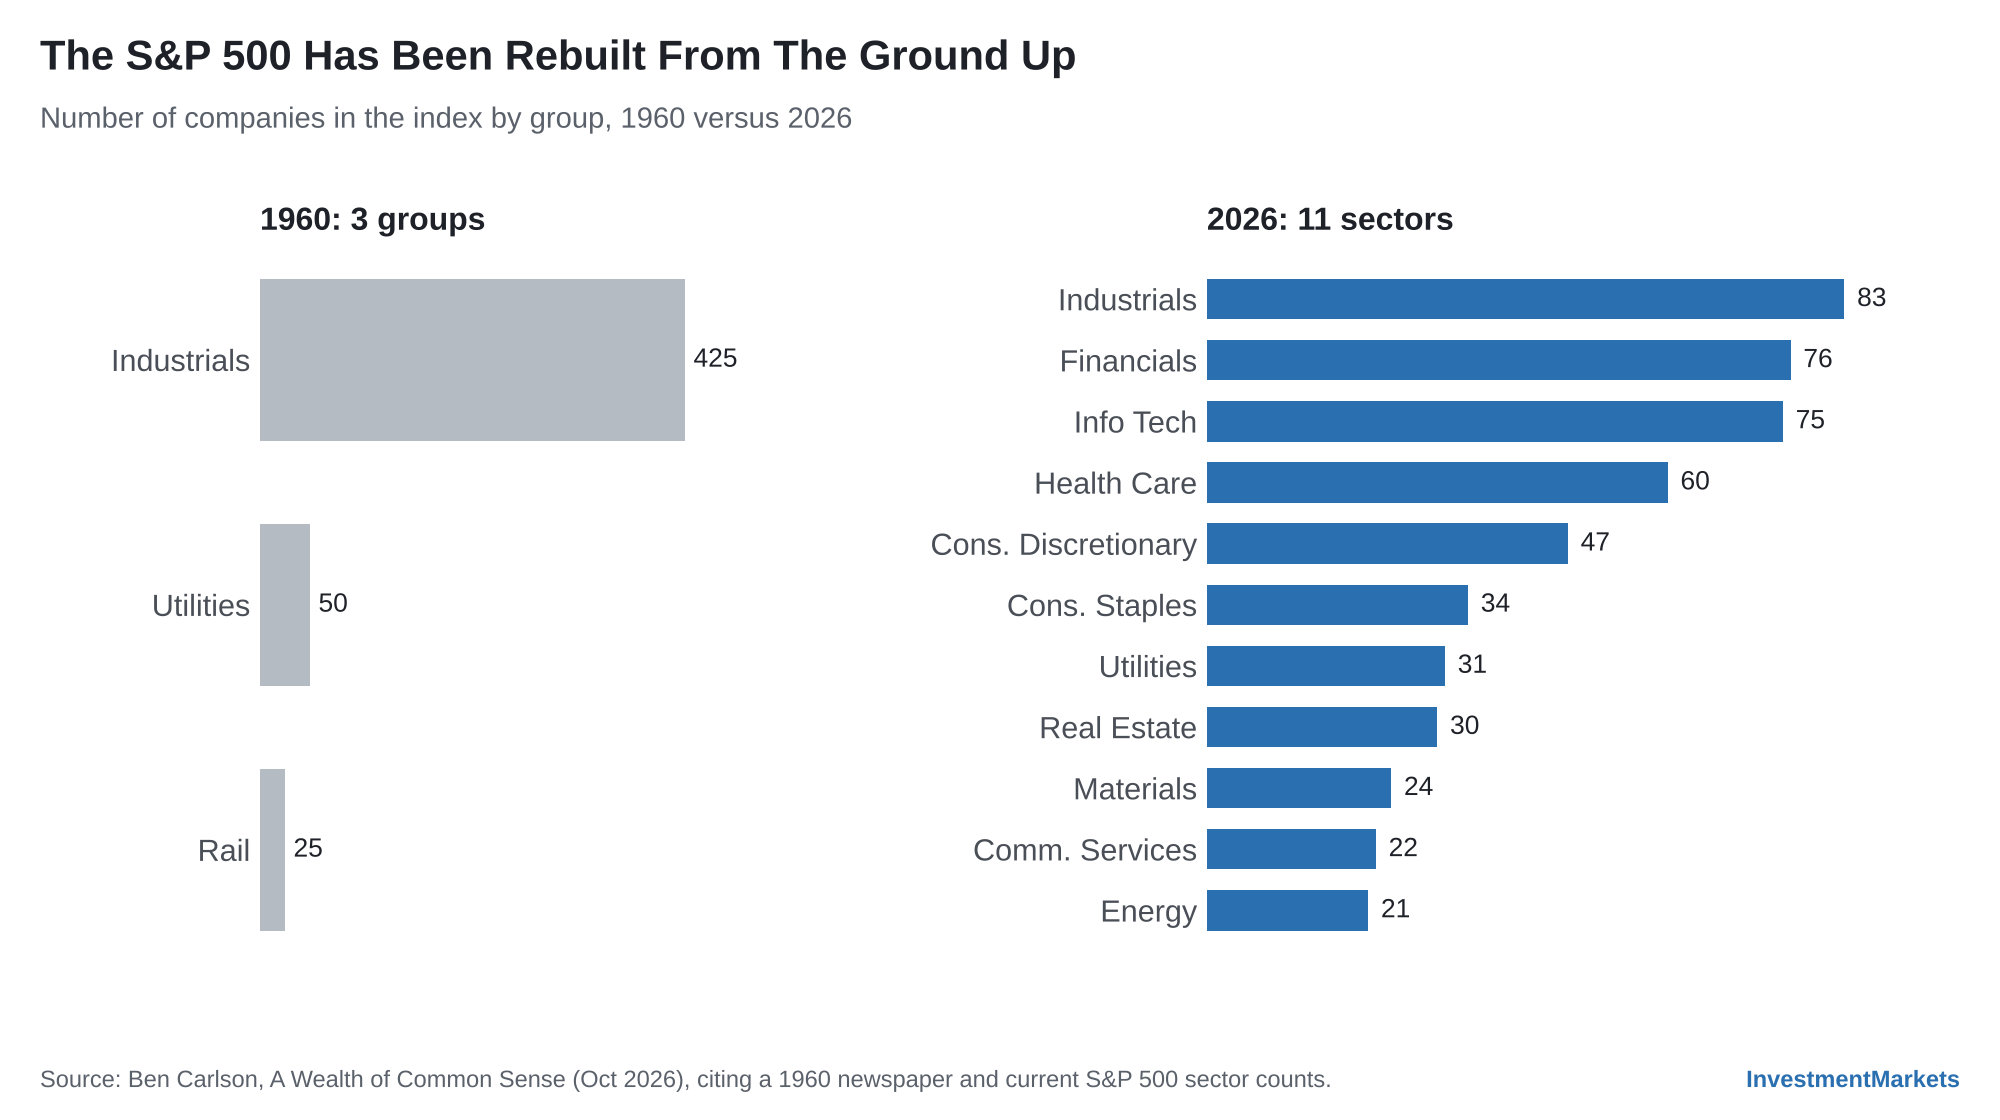
Source: Ben Carlson, A Wealth of Common Sense, October 2026.
Explore 100's of investment opportunities and find your next hidden gem!
Search and compare a purposely broad range of investments and connect directly with product issuers.
What Has Changed?
Plenty has changed in recent decades, and much of it in investors’ favour.
| Then | Now |
Biggest US industry | Railways: 63% of the US market (1900) | Railways: less than 1% |
Index make-up | S&P 500 in 1960: three groups | 11 sectors, led by technology |
Fund fees in Australia | First modern unit trust (1936): 7.5% entry fee | Core Australian share ETFs from 0.03% a year |
Australian brokerage | Fixed commissions until April 1984 | Set by competition |
Company information | Selective briefings to favoured investors | Released to everyone at once; data free on a phone |
Sources: UBS Global Investment Returns Yearbook 2026; Ben Carlson; Money magazine; Macquarie University; Global X ETFs.
The Companies You Own
It may surprise you how dominant the railway industry once was. The UBS Global Investment Returns Yearbook 2026 shows that railways made up 63% of the US market in 1900, compared with less than 1% today.
Conversely, 70% of today’s US stocks come from industries that were small or non-existent in 1900.
The dominance of the largest stocks in the US is also unusual by historical standards.
The ten largest S&P 500 stocks reached a record 40.7% of the index at the end of 2025 and still held about 39% in early October 2026. NVIDIA, Apple and Microsoft alone now account for more than 21% of the index, the highest three-stock concentration in its history.
UBS believes US market concentration as the highest in at least 100 years.
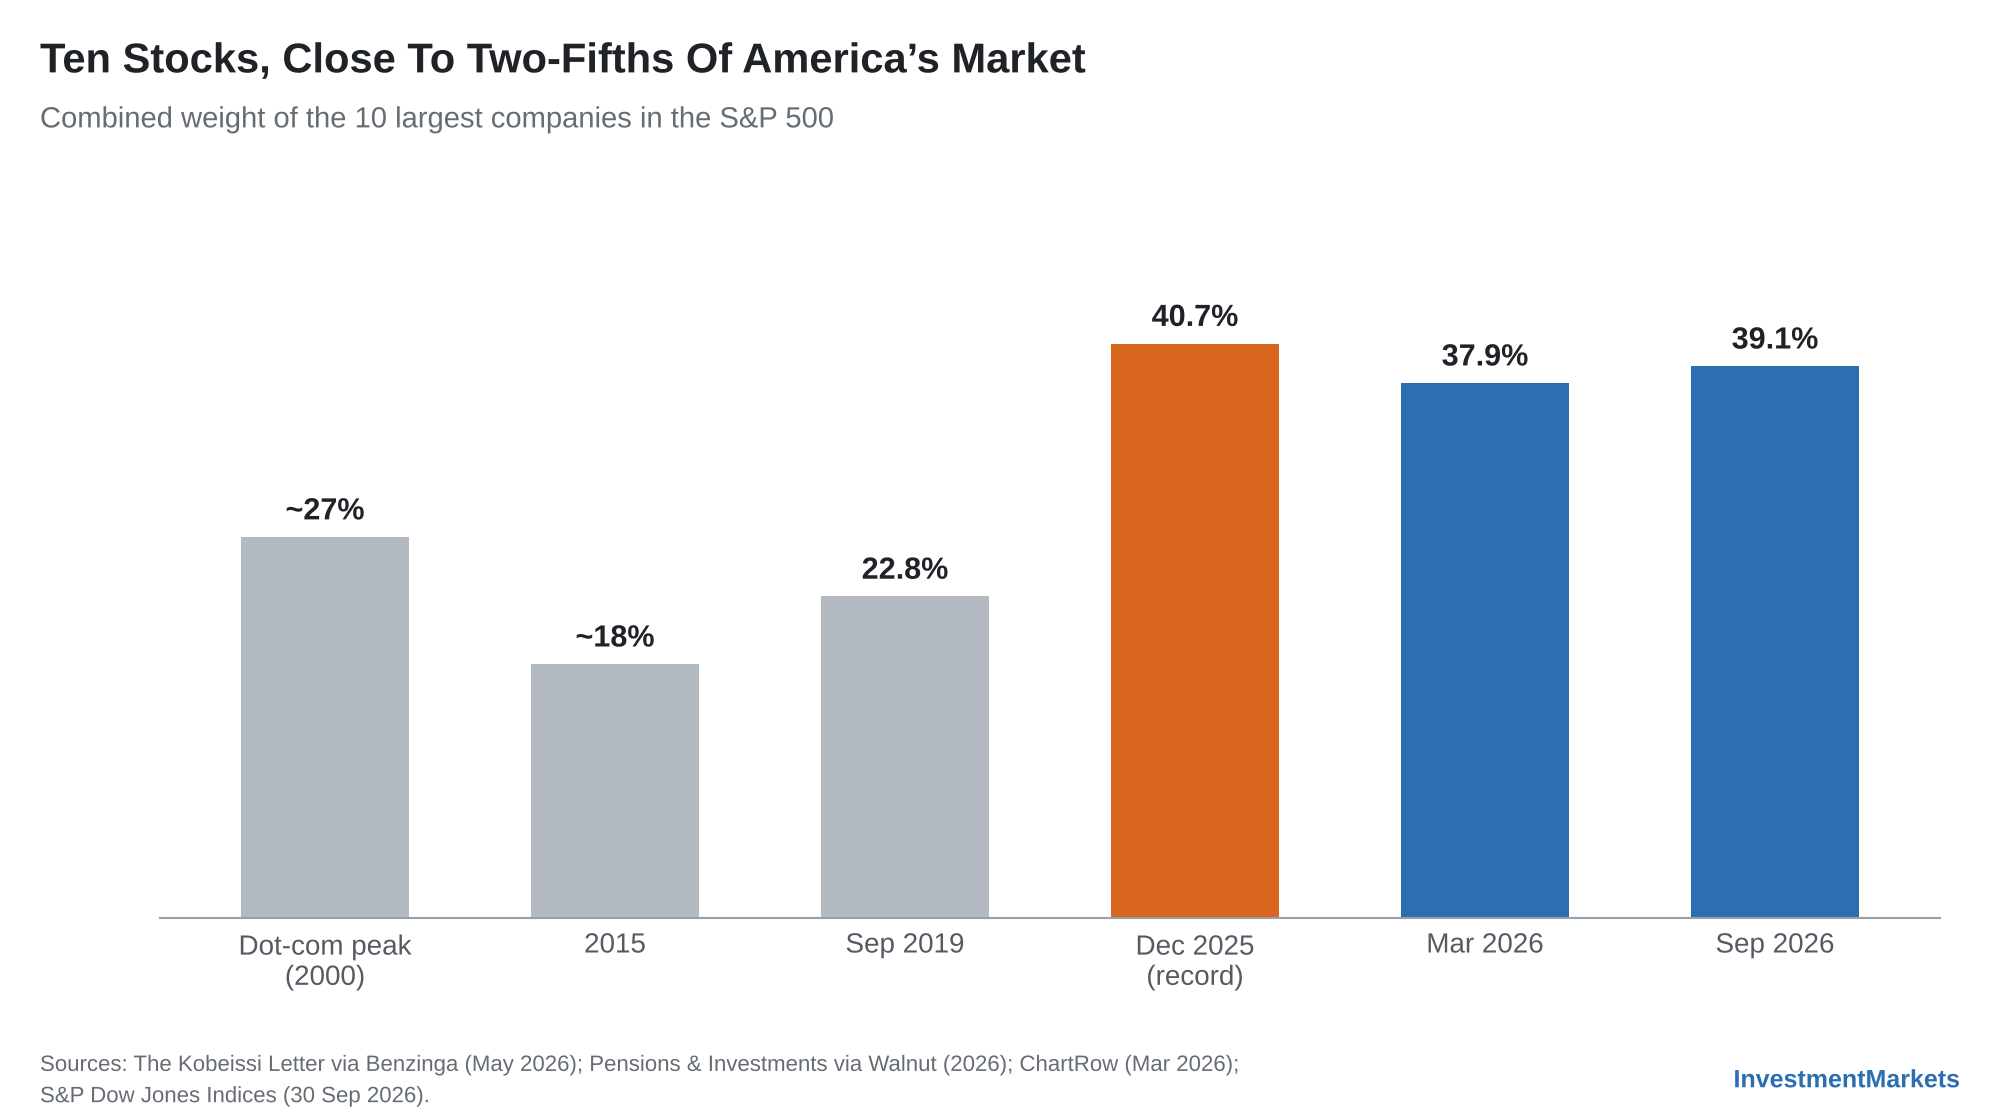
Sources: The Kobeissi Letter via Benzinga; Pensions & Investments; ChartRow; SPDR S&P 500 ETF holdings via 24/7 Wall St; UBS Global Investment Returns Yearbook 2026.
This US large-cap dominance extends to global indices. The US now accounts for 73% of the MSCI World Index, up from less than half in 2006.
Hence, Australians holding global ETFs are mainly exposed to the US, and to a handful of US technology giants in particular. That’s a very different backdrop from earlier eras.
Many popular global ETFs on the ASX track the MSCI World ex Australia Index, so check their US and top-ten weightings before assuming you are broadly diversified.
The Falling Cost of Getting In
The cost of investing has changed beyond recognition.
US investors once paid 2% or more in brokerage and 5% to 8% in fund sales loads.
Australia was no different. The country’s first modern unit trust, launched by Australian Fixed Trusts in 1936, charged an entry fee of 7.5%. Brokerage fees were fixed until a Trade Practices Commission ruling took effect in April 1984.
Today, core Australian ETFs charge as little as 0.03% a year. On a $100,000 portfolio, that’s $30 a year.
After costs, investors have never had it better.
The Fleeting Information Edge
The investment playing field is far more level than it used to be.
Rules such as America’s Regulation FD, introduced in 2000, require companies to release material information to everyone at once. In Australia, the ASX’s continuous disclosure regime does a similar job.
Data that once took weeks to compile is now free on a phone.
So, the easy edges have largely been competed away.
‘The plumbing of markets keeps improving. Human nature doesn’t get an upgrade.’
Subscribe to InvestmentMarkets for weekly investment insights and opportunities and get content like this straight into your inbox.
What Hasn’t Changed?
Before you conclude that this time really is different, consider what hasn’t changed.
Human Nature
Investors have always chased investments after they have risen and sold their laggards into weakness. We are hardwired to chase easy gains and avoid short-term pain.
If anything, the ease of digital trading has amplified these biases.
Case in point: Morningstar’s latest Mind the Gap study, published in August 2026, found the average dollar invested in US funds and ETFs earned 8.7% p.a. over the decade to December 2025, against 9.9% for the funds themselves. That gap of 1.2% p.a. cost investors 12% of their funds’ returns. ETF investors fared worse on timing, with a gap of 1.6% p.a.
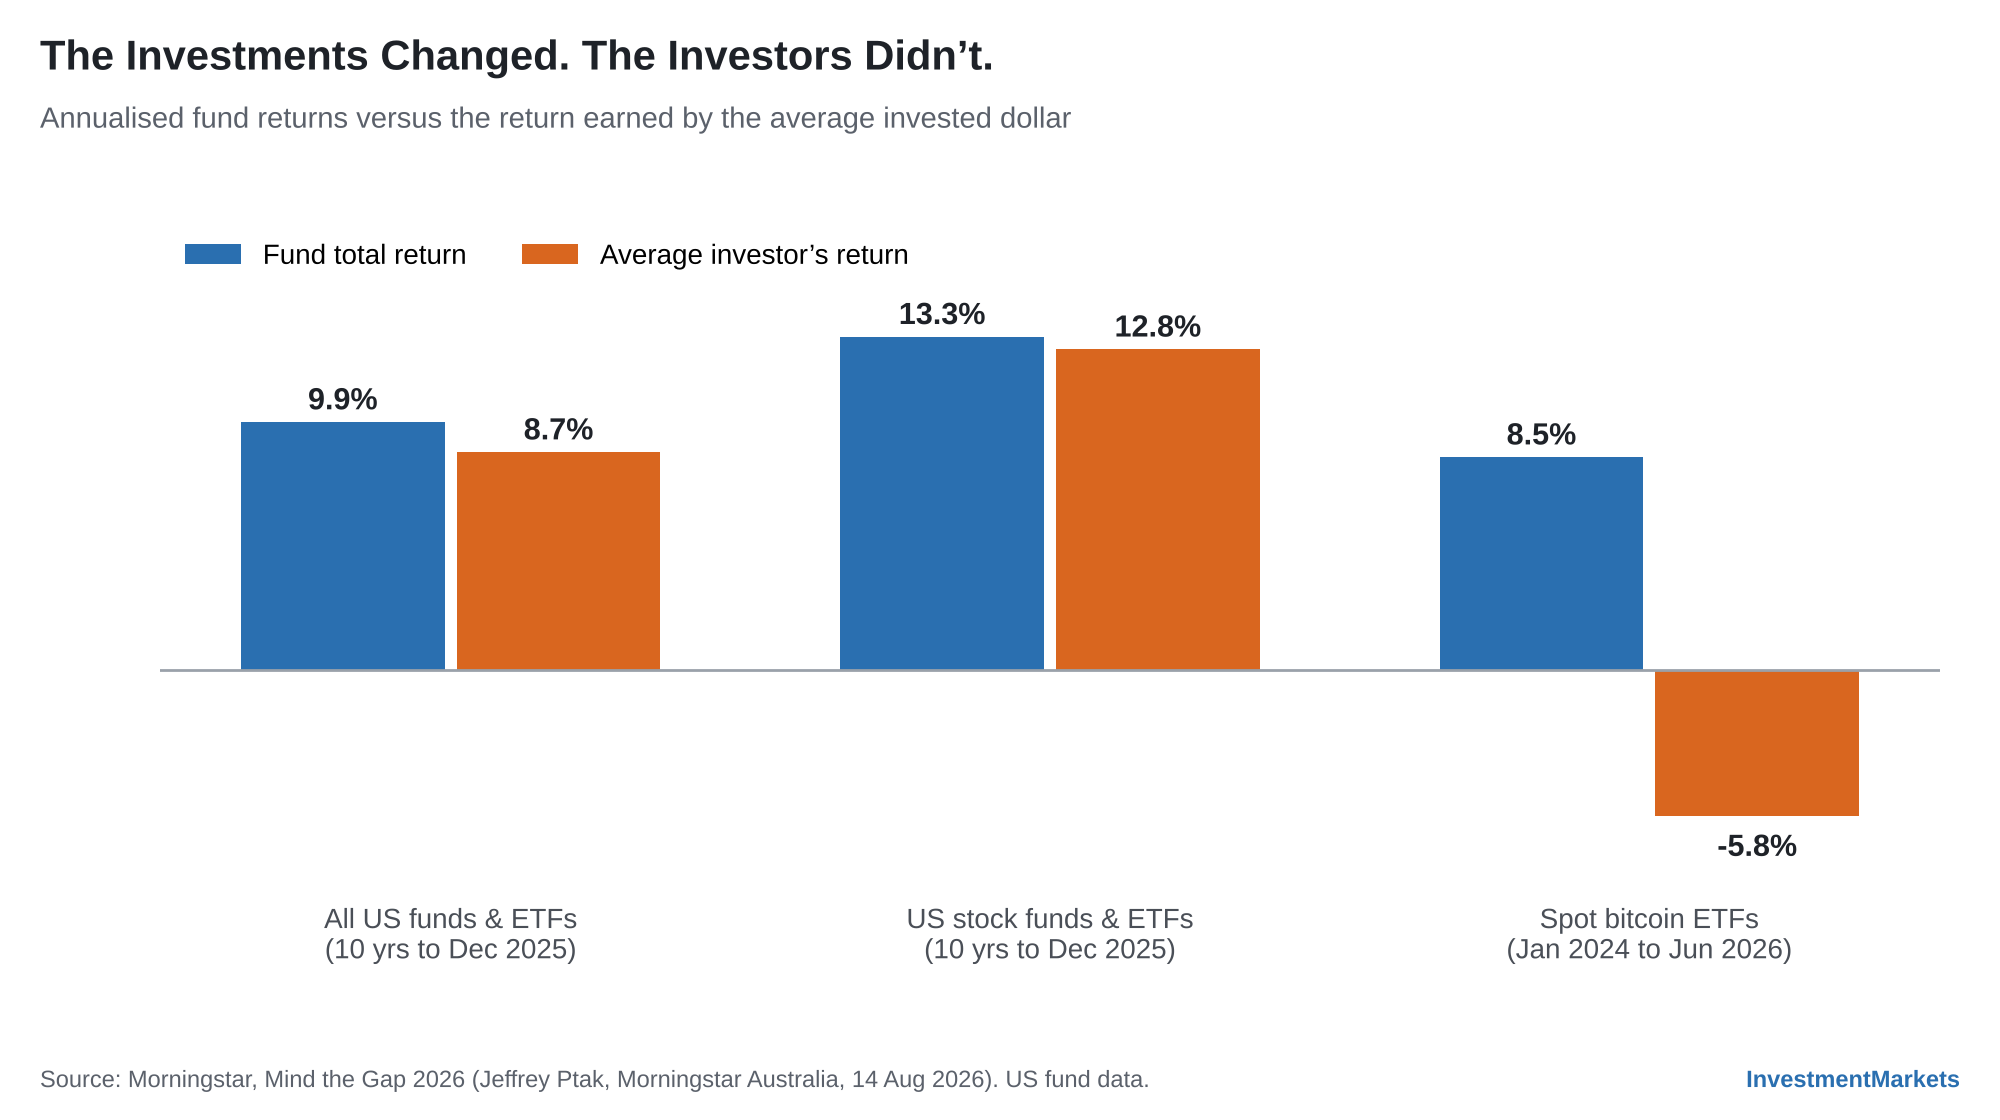
Source: Morningstar, Mind the Gap 2026. US fund data.
Australian investors have historically done a little better versus their funds.
Morningstar’s most recent Australian study, Mind the Gap 2023 – Investor Returns Around the World, found the average dollar in Australian-domiciled funds and ETFs earned 5.52% p.a. over the five years to June 2023, against 5.9% p.a. for the funds themselves. That gap of 0.4% p.a. cost investors 7% of their funds’ returns, which was jointly the smallest shortfall of the six markets studied.
Morningstar credited more holistic financial advice and the discipline of superannuation as being helpful.
The detail is instructive for ETF investors.
Australian ETF investors lost just 0.09% p.a. to poor timing, against 0.59% p.a. for those in active equity funds. Multi-asset investors kept about 96% of their funds’ returns, while investors in alternatives kept only about a third.
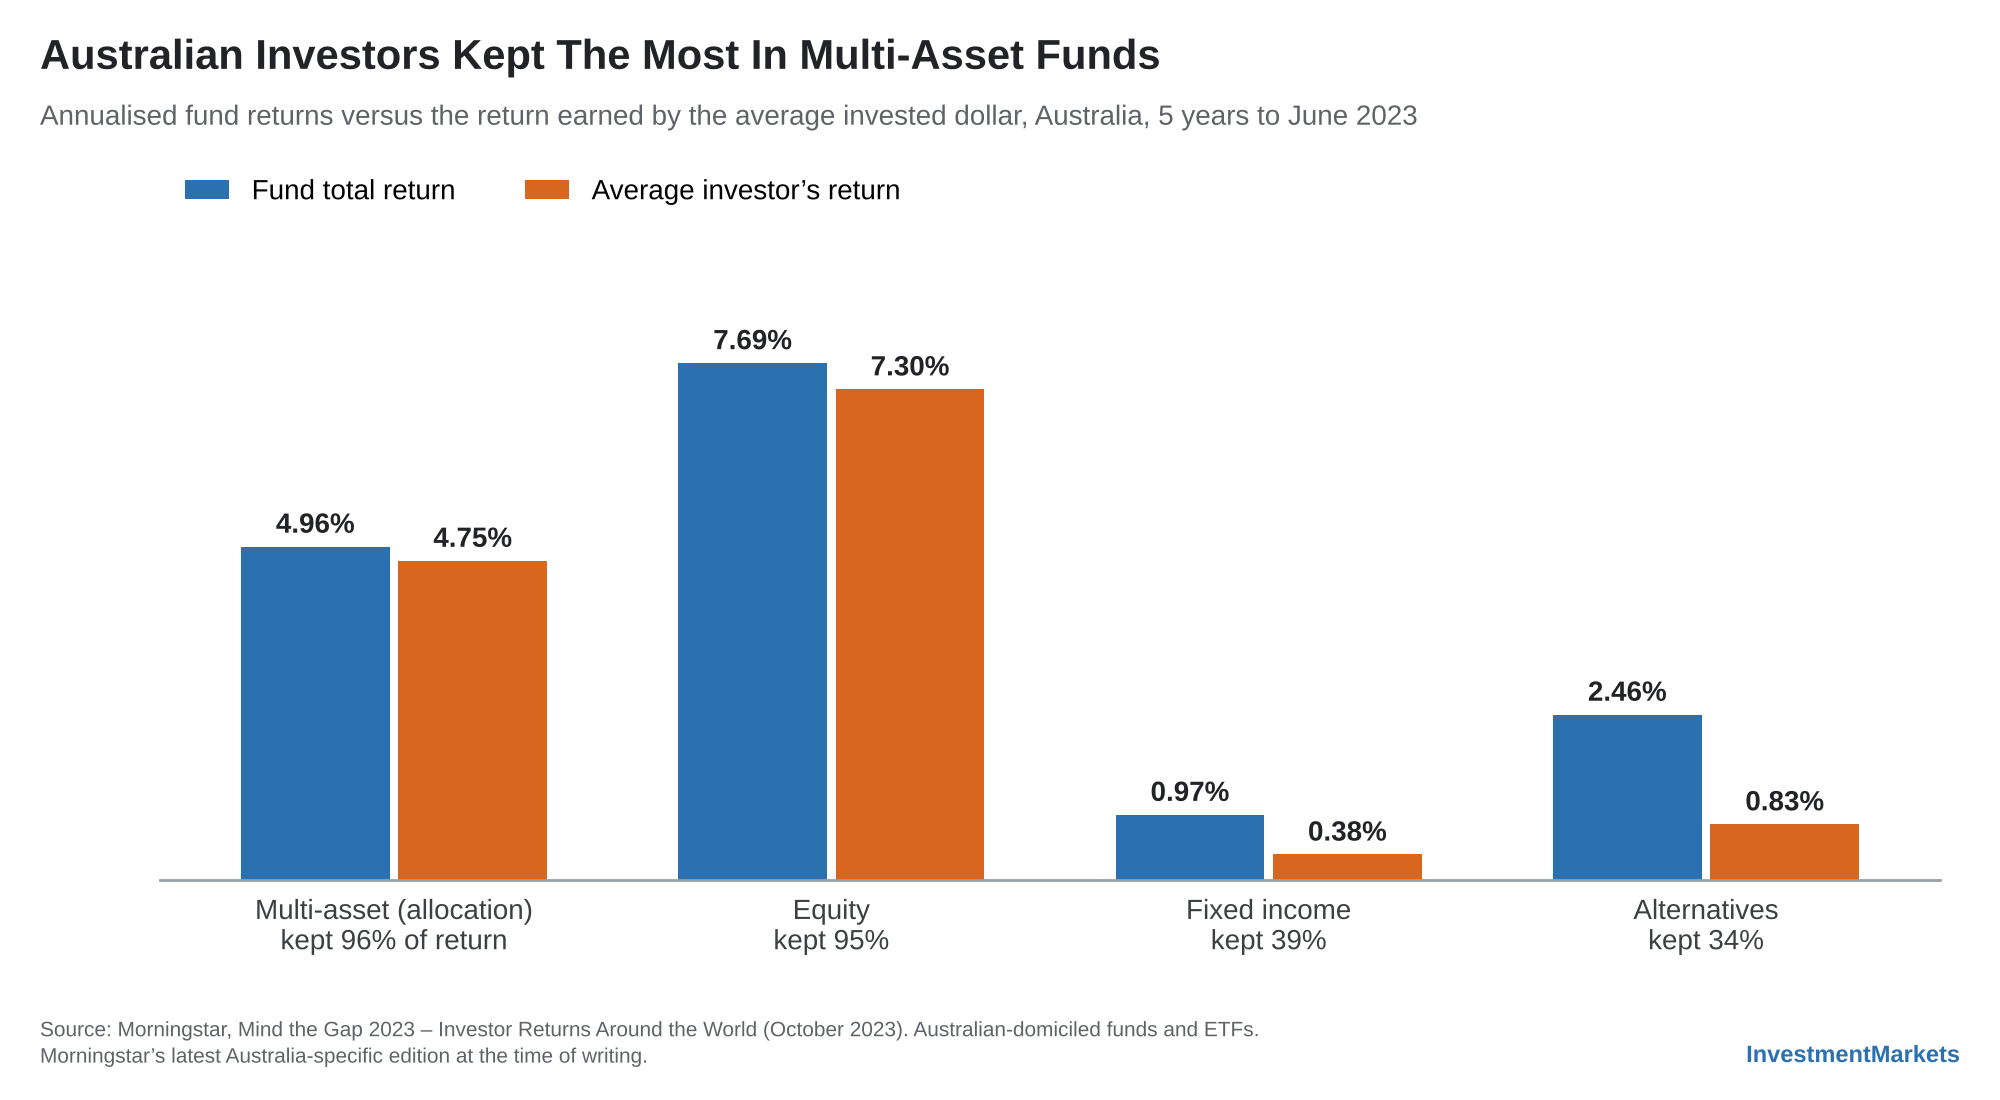
Source: Morningstar, Mind the Gap 2023 – Investor Returns Around the World. Australian-domiciled funds and ETFs.
Outperforming the Market Is as Hard as Ever
Beating the market has always been difficult.
In the first half of 2026, S&P Dow Jones Indices found that dispersion among global stocks reached levels last seen during the global financial crisis. In theory, that’s a stock picker’s paradise: with such a wide gap between the best and worst performers, skilled managers should be able to shine.
The results were less encouraging.
Over the six months to June 2026, 78% of Australian general equity funds still trailed the S&P/ASX 200, putting 2026 on track for the second-highest underperformance rate since 2013.
Part of the problem is that only 35% of ASX 200 stocks beat the index over the half, so the odds of picking winners are stacked against managers.
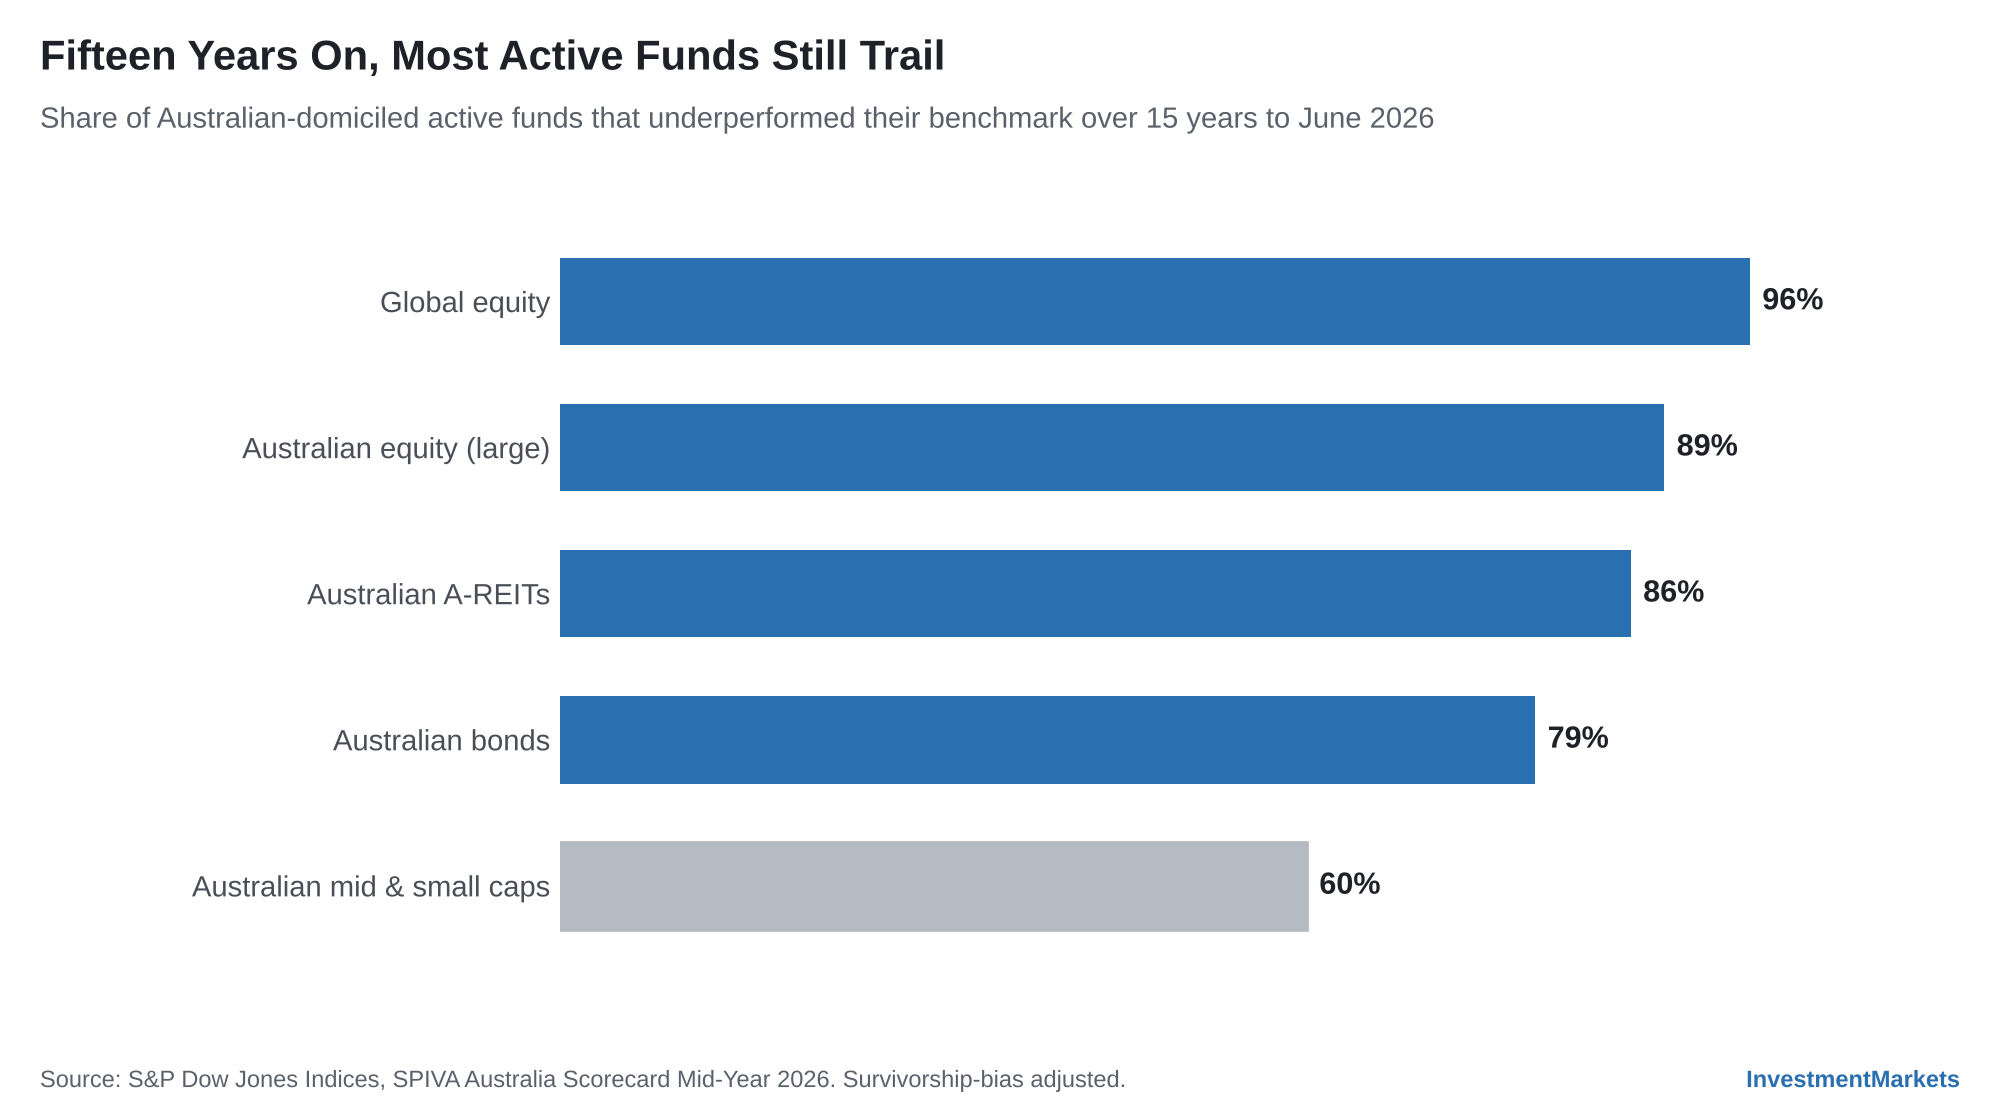
Source: S&P Dow Jones Indices, SPIVA Australia Scorecard Mid-Year 2026.
How to Profit from Change & Stasis Concurrently
In short, the structural changes are opportunities, while the behavioural constants are risks. Investors who exploit the first and guard against the second have a measurable advantage. Here’s how.
1. Diversify Beyond the Mega-Caps, at Home and Abroad
Concentration is not only an American problem. The 20 largest stocks make up 63.4% of the S&P/ASX 200, up from 61.0% six months earlier. Materials account for 27% of the index, with BHP alone at 11.7%.
Franking credits are one reason many Australians favour local shares, but they also deepen their home market bias. Weigh the tax benefit against the concentration risk.
Currency is the other lever. The UBS Yearbook found that currency risk added 6% to total risk, and that hedged global portfolios beat domestic ones in most markets.
For Australians, though, the case is not clear-cut. The Australian dollar has tended to fall when global markets sell off, which has cushioned unhedged global shares in downturns. Hedging pays when the Australian dollar strengthens, as it did against a softer US dollar in the first half of 2026.
As a result, most investors hold a mix of hedged and unhedged exposure.
Global equity funds and currency-hedged ETFs are useful tools to achieve diversified global exposure, though their typically high concentration means it’s vital to check what you own.
Our guide to equal-weight ETFs explains one way to dilute exposure to the mega-caps.
2. Cut Costs Where Paying More Buys You Nothing
A core ETF can cost as little as 0.03% p.a., so any funds charging higher fees needs to earn their keep.
If you choose active management through active ETFs or Australian equity funds, the SPIVA data suggests mid- and small-cap managers have had better odds of outperforming, although 76% underperformed over ten years and 60% over 15 years.
3. Automate, Then Leave It Alone
Morningstar found that Australian investors in diversified, multi-asset funds lost the least to poor timing, keeping about 96% of their funds’ returns.
That strengthens the case for multi-asset portfolios and regular contributions over reactive trading.
Superannuation illustrates this approach working in all its glory. Regular contributions, long time horizons and limited switching help explain why Australians rank among the world’s most effective fund investors.
YOUR FIVE-MINUTE CHECKLIST
- Look up your global ETF’s US weighting and its top ten holdings.
- Add up how much of your Australian share exposure sits in BHP, the big four banks and CSL.
- Compare every fund’s fee with a low-cost index alternative and ask what the difference buys.
- Decide your hedged versus unhedged split in advance, not in the middle of a sell-off.
- Set up a regular investment plan, rebalance annually and don’t trade unless it’s for a pre-decided reason.
The Plumbing Has Improved. Investors Haven’t.
Markets are always different this time to some extent. The market Poseidon traded on, the costs investors paid and the speed of information would all be unrecognisable to a 1969 punter. What would feel familiar is the euphoria at the top and the despair at the bottom.
The investors who do best over the coming decade will be those who take every structural gift on offer, from cheap ETFs to easy global access, while refusing to believe that their own emotions have been upgraded along with the technology.
For more on why doing less often earns more, read Why Most Stock Pickers Can’t Beat ETFs.
Frequently Asked Questions
Who said ‘this time is different’ is dangerous in investing?
Sir John Templeton, the pioneering global investor, in his 1993 ‘16 Rules for Investment Success’. He called it among the four most costly words in the annals of investing. He was warning investors against repeating past mistakes, not claiming that markets never evolve.
Is the US share market more concentrated than ever?
Close to it. The ten largest S&P 500 stocks reached a record 40.7% of the index at the end of 2025 and still held about 39% in October 2026. UBS describes US market concentration as the highest in at least 100 years, and NVIDIA, Apple and Microsoft alone now make up more than 21% of the index.
How concentrated is the ASX 200?
Very. The 20 largest stocks made up 63.4% of the S&P/ASX 200 at June 2026, according to S&P Dow Jones Indices. Materials account for about 27% of the index and BHP alone for 11.7%, so an ASX 200 ETF is a far less diversified holding than many investors assume.
Can investors still beat the market?
Some do, but few consistently. SPIVA data shows 89% of Australian general equity funds and 96% of global equity funds lagged their benchmarks over the 15 years to June 2026. For most investors, lower costs and better behaviour are more reliable sources of outperformance.
What is the investor behaviour gap?
It is the difference between a fund’s published return and the return earned by the average dollar invested in it, which reflects when investors buy and sell. Morningstar puts the US gap at 1.2 percentage points a year over the decade to 2025, and the Australian gap at 0.40 percentage points a year over the five years to June 2023.
How can Australian ETF investors close the behaviour gap?
Trade less, automate regular contributions, rebalance to set targets and favour diversified holdings. In Morningstar’s Australian study, investors in passive equity funds lost just 0.09 percentage points a year to poor timing, and multi-asset investors kept about 96% of their funds’ returns.
Source: S&P Dow Jones Indices, SPIVA Australia Scorecard Mid-Year 2026.
There is no single right answer. Hedging reduces currency volatility and pays when the Australian dollar rises, but an unhedged position has historically cushioned Australians in global sell-offs, because the Australian dollar tends to fall at those times. Many investors hold a mix of hedged and unhedged exposure.
Sources
- Firstlinks, Fifty years ago, Poseidon made today’s WAAAX look waned
- WealthManagement.com, Investors beware: this time really is different (Templeton, 1993)
- Ben Carlson, Markets Are Always Different This Time, October 2026
- UBS Global Investment Returns Yearbook 2026
- ChartRow, S&P 500 concentration
- 24/7 Wall St, Three stocks are now 21% of the S&P 500, October 2026
- Daily Maverick, Just how top-heavy are global equity indices today?, August 2026
- Morningstar, Mind the Gap 2026 (Morningstar Australia, August 2026)
- Morningstar, Mind the Gap 2023 – Investor Returns Around the World
- Financial Analysts Journal, Bad Timing Does Not Cost Investors 15% of Their Funds’ Returns, May 2026
- S&P Dow Jones Indices, SPIVA Australia Scorecard Mid-Year 2026
- CommSec, FY2026 review, July 2026
- Global X ETFs, Australia 300 ETF (A300)
Disclaimer: This article is prepared by Simon Turner. It is for educational purposes only. While all reasonable care has been taken by the author in the preparation of this information, the author and InvestmentMarkets (Aust) Pty. Ltd. as publisher take no responsibility for any actions taken based on information contained herein or for any errors or omissions within it. Interested parties should seek independent professional advice prior to acting on any information presented. Please note past performance is not a reliable indicator of future performance.
Author

Simon Turner
Head of Content (CFA), InvestmentMarkets
Related Articles
-s5c0uf81il26meg3icyx.png)

Categories
Recent Articles
View all articles-9w2h9oz18b9y363ubw7y.png)
-8vp7vkl6lrlbdlb7l4yg.png)
-kxlueh4dd6evxs8gumtc.png)