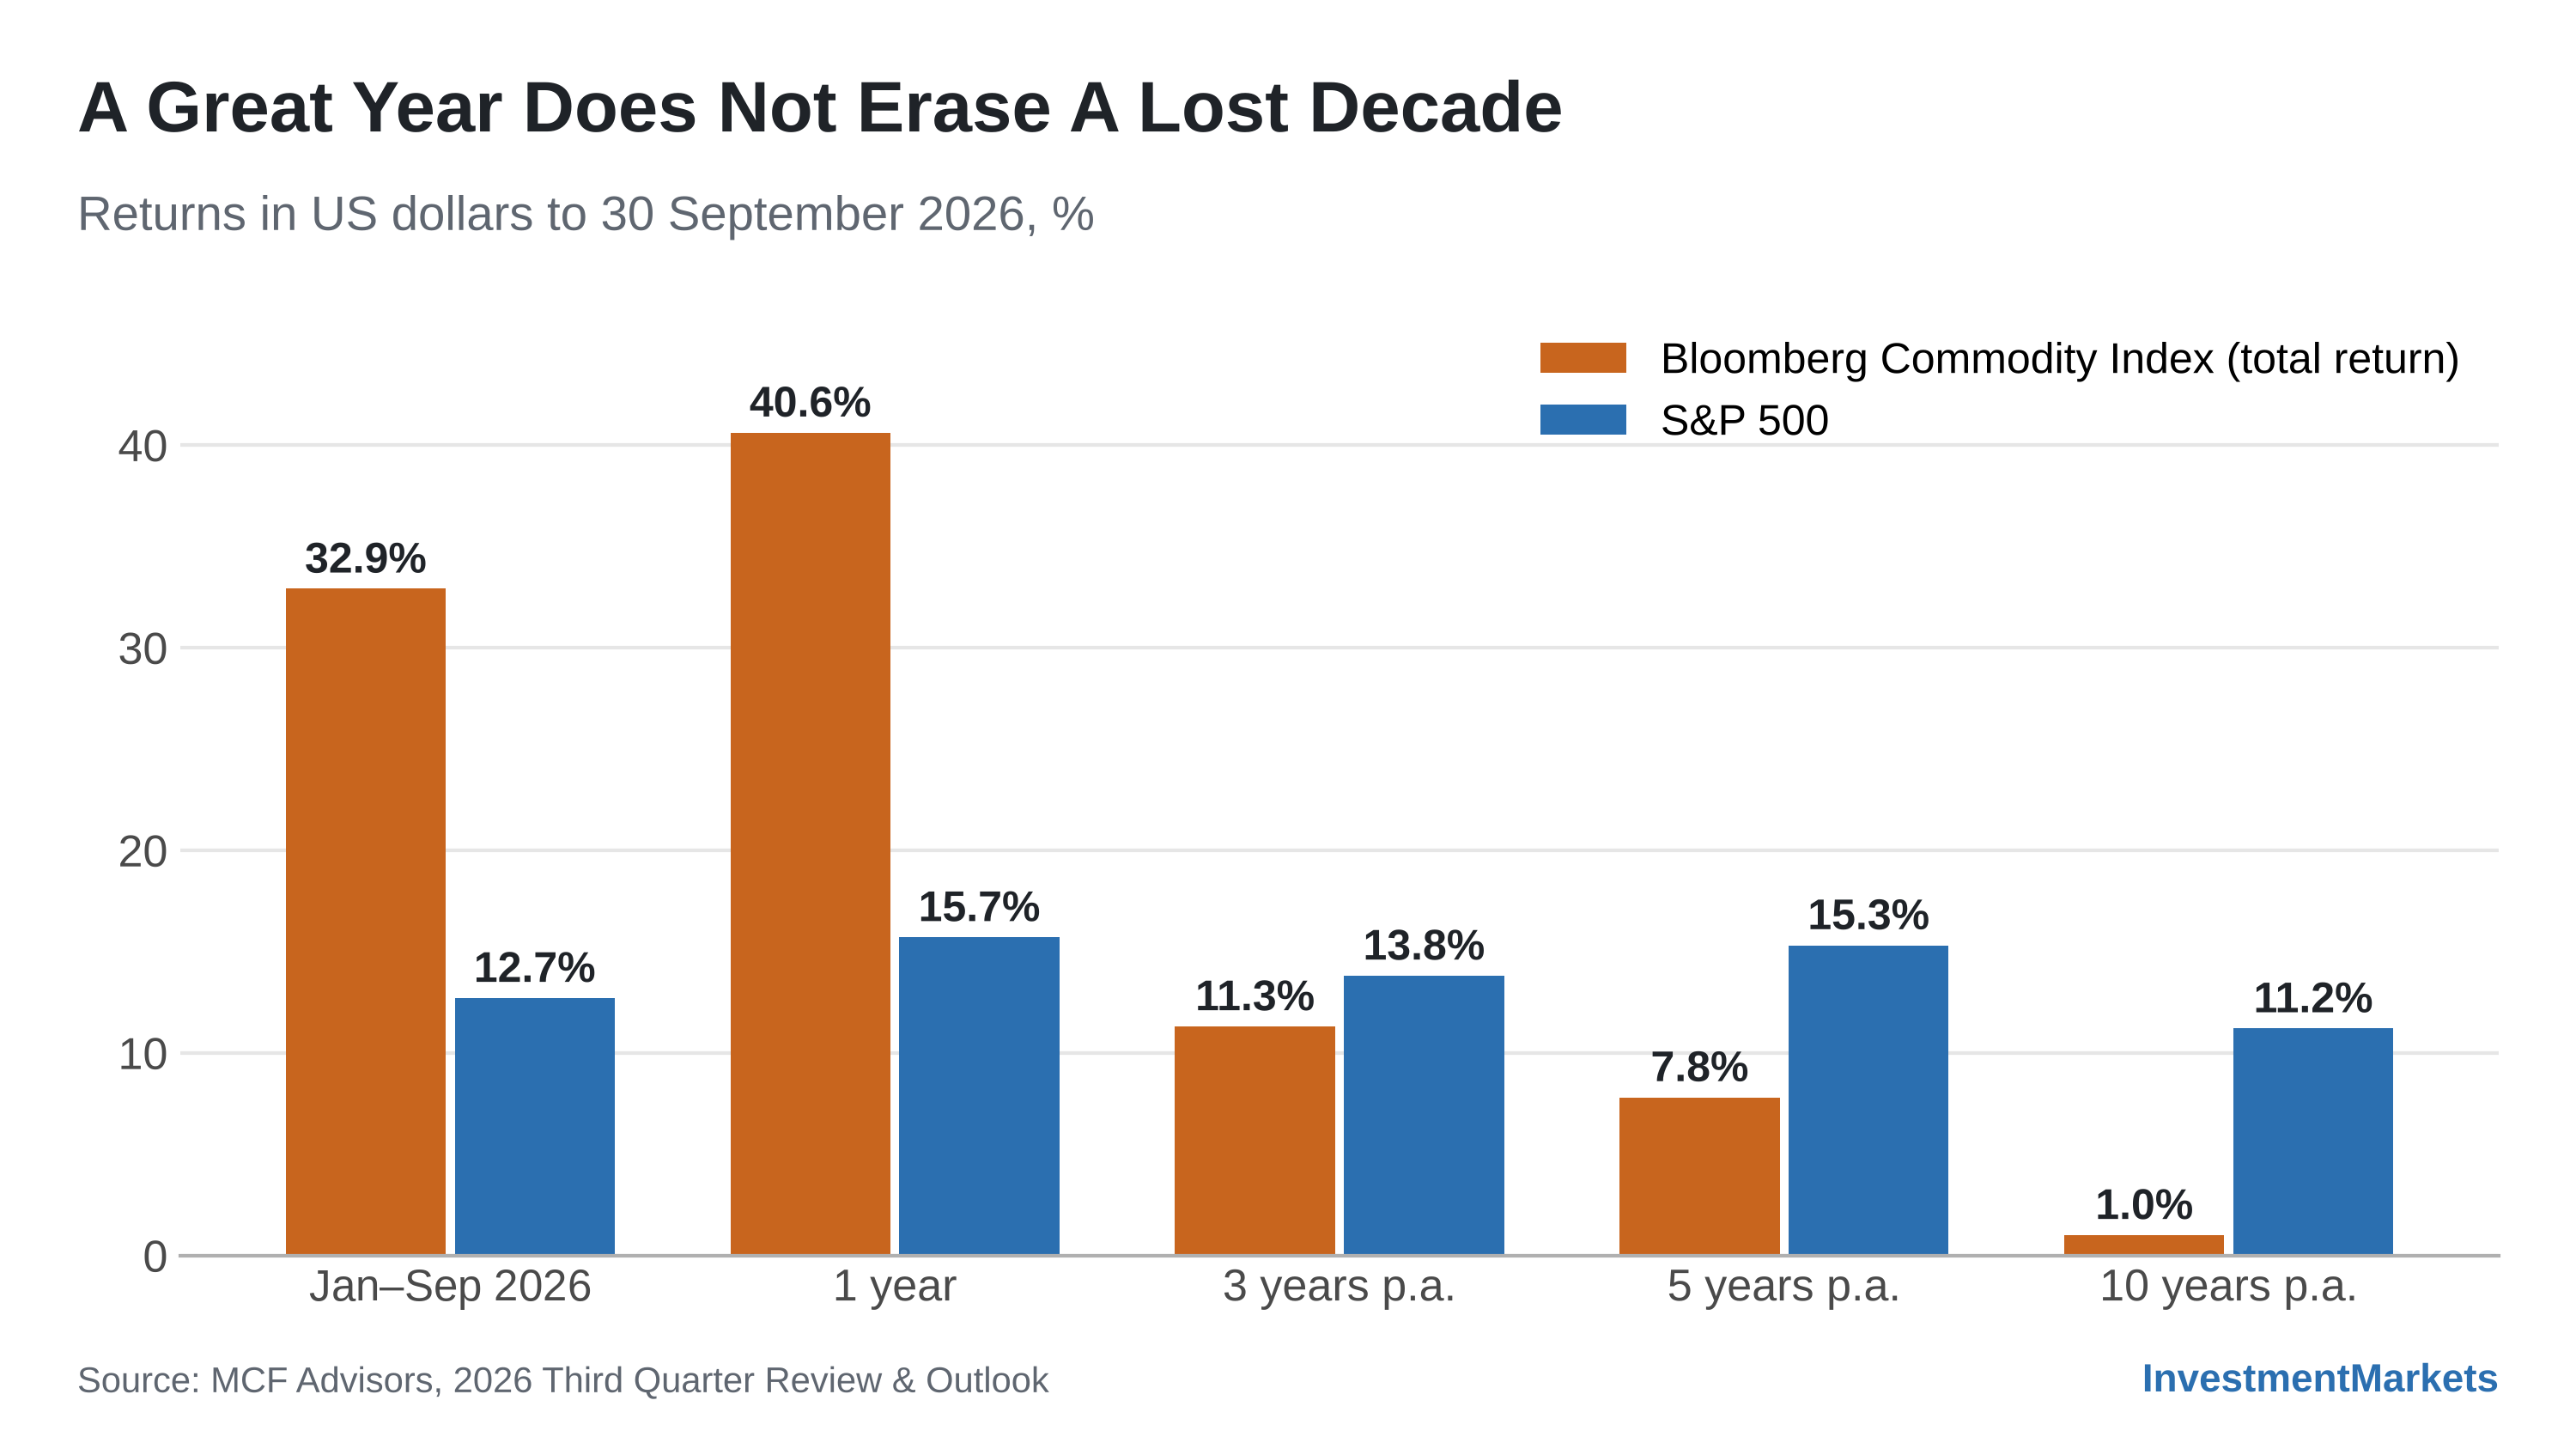
Commodities have been one of the standout asset classes of the year, with the Bloomberg Commodity Index rising 33% in the first nine months of 2026, its strongest result in decades.
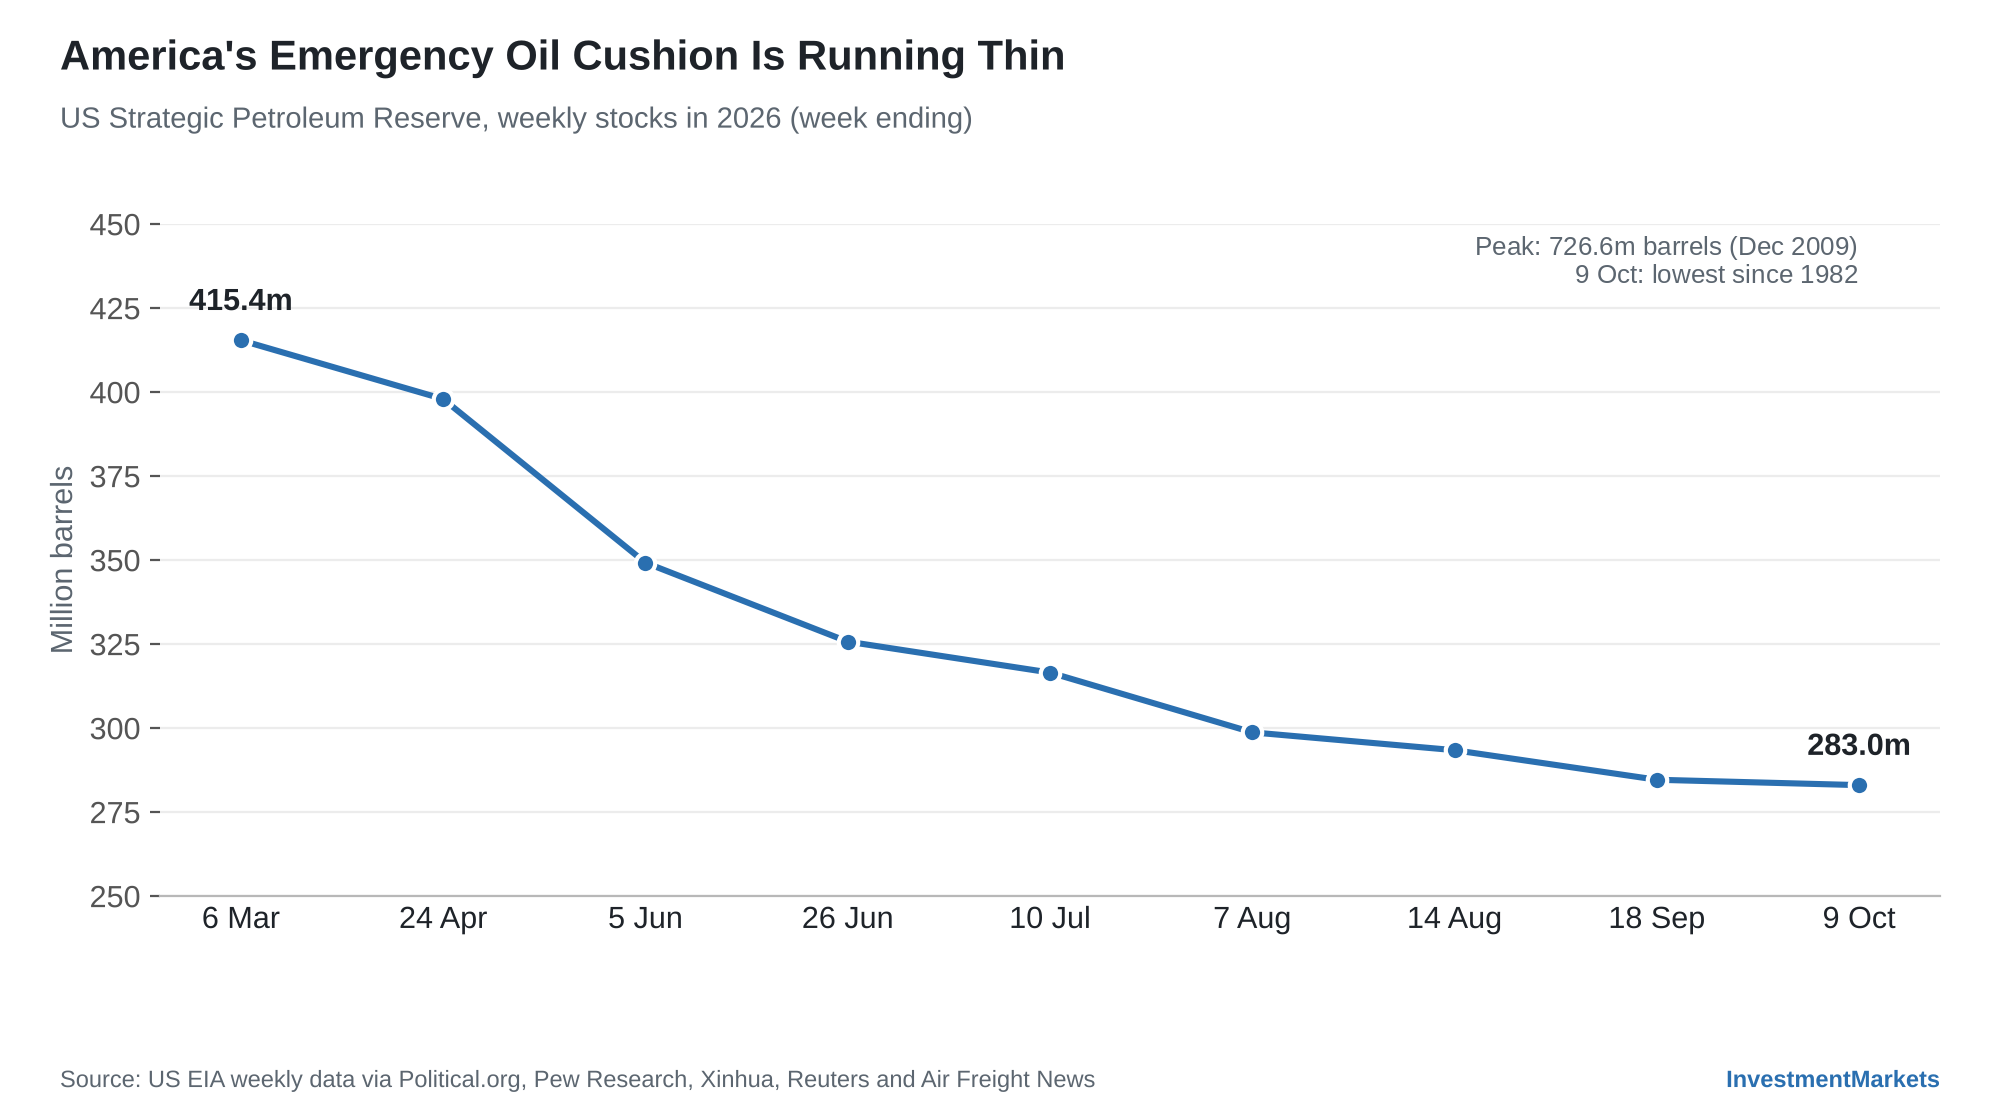
Brent crude led the way, rising more than 90% between the start of 2026 and late October, while America’s emergency oil reserve fell to its lowest level since 1982.
Some prominent voices argue this is only the beginning of a decade-long bull market. Their thesis rests on a global commodity shock in 2027 and 2028, and a ‘generational’ opportunity to escape inflation through hard assets.
The short answer is that a supply shock and a super-cycle are not the same thing.
Shocks happen when buffers run thin; super-cycles have historically also needed falling real interest rates, a weaker US dollar and sustained demand growth.
The stakes are unusually high for Australian investors. The country earns a large share of its income from commodities, yet imports most of its fuel. Getting commodities right may be one of the more important asset allocation decisions you make over a full commodity cycle.
Key Takeaways
Shocks and super-cycles are different: supply shocks bite hardest when inventories are thin, but decade-long bull markets have also needed falling real interest rates and a weaker US dollar.
The physical case in 2026 is strong: oil, diesel and strategic inventories were drawn down to unusually low levels, leaving little cushion against further disruption.
The monetary case is weaker: US Treasury bond buybacks are debt management, not money printing, and the US Federal Reserve was tightening rather than easing.
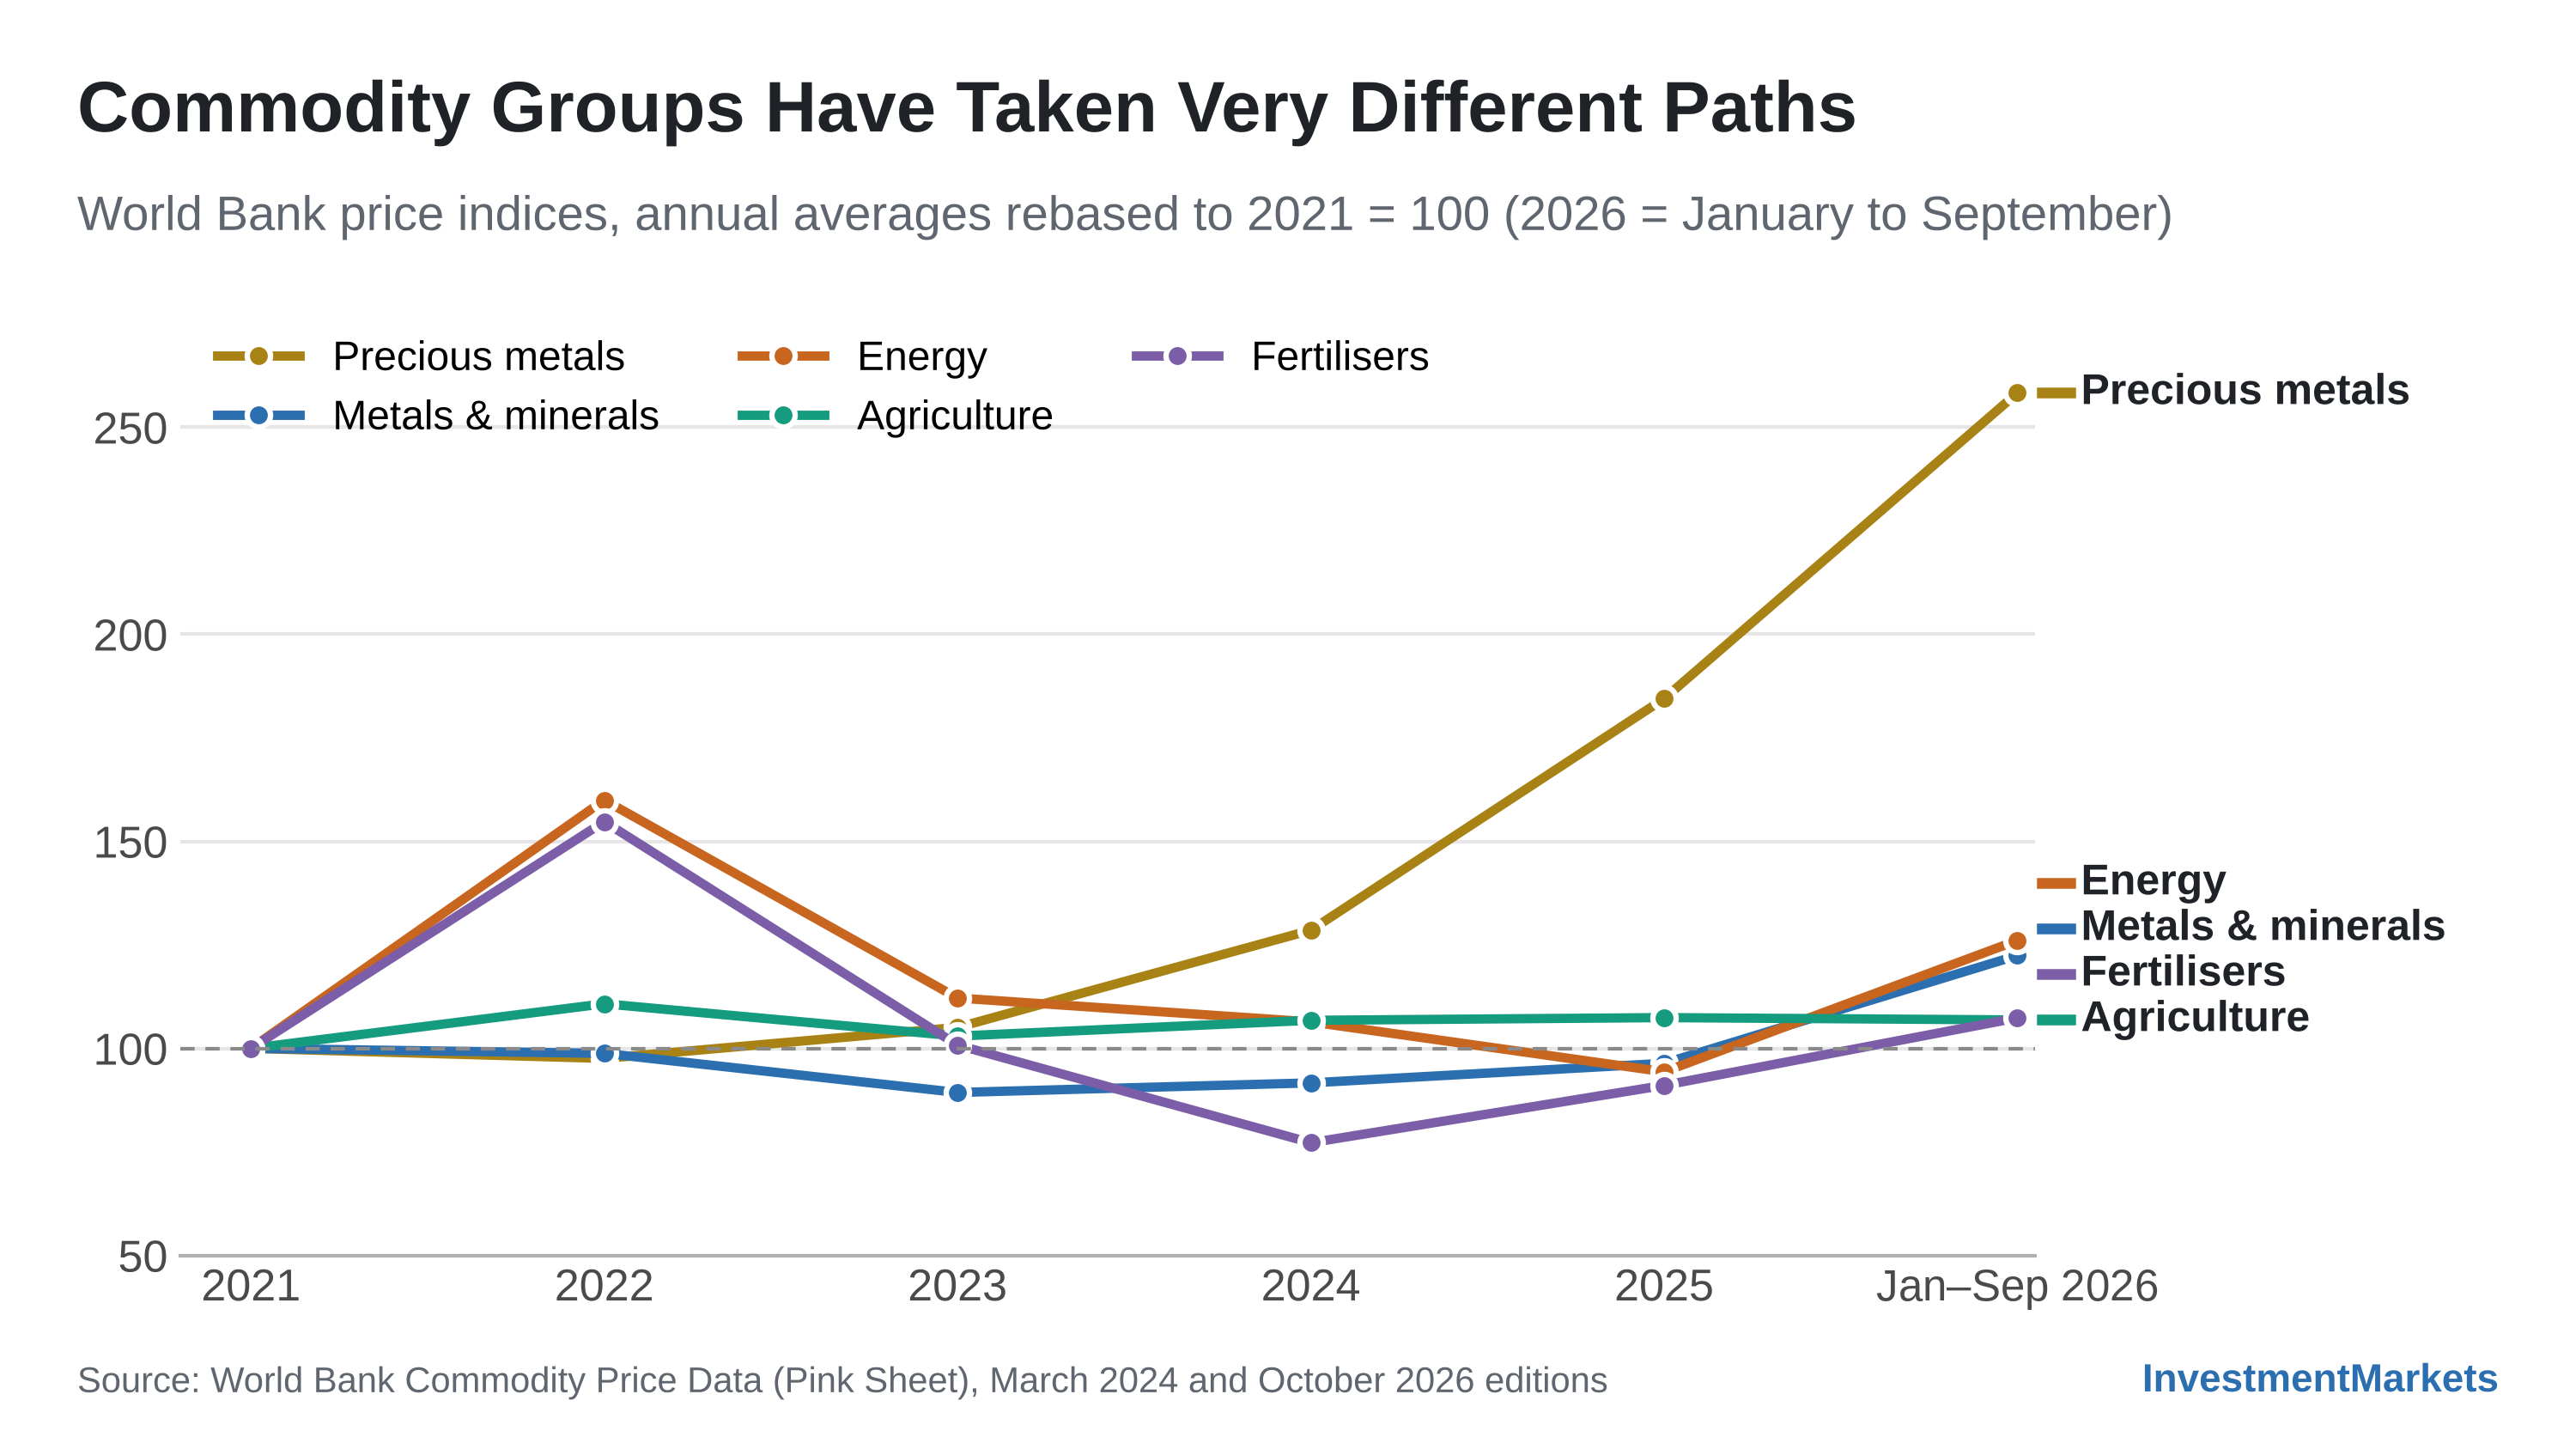
Commodities do not move as one asset: precious metals, copper, energy, grains and iron ore have followed very different paths over the past five years.
One strong year does not erase history: broad commodities returned 1% p.a. over the decade to September 2026, against 11.2% p.a. for US shares.
A measured commodity allocation can add portfolio resilience, but structure, sizing and awareness of your existing resources exposure matter more than conviction.
Explore 100s of investment opportunities and find your next hidden gem!
Search and compare a purposely broad range of investments and connect directly with product issuers.
Commodity Shock vs Super-Cycle: What’s the Difference?
A commodity shock is a sharp and often short-lived price spike caused by a sudden loss of supply, such as a war, embargo or blockade.
A commodity super-cycle is a much longer period, typically a decade or more, in which prices stay elevated across many commodities.
History suggests the two need different ingredients.
A shock needs a supply disruption to hit a market with little spare inventory.
Super-cycles, such as those of the 1970s and 2000s, have also needed falling or negative real interest rates, a weakening US dollar and sustained demand growth, which in the 2000s came from China’s rapid industrialisation.
The Bull Case in Brief
There are two theses worth being aware of.
The first is monetary.
It argues that once central banks shift from rate hikes to rate cuts, yield-curve control and quantitative easing (QE), and once inflation makes bonds less attractive on a relative basis, global capital will flood into commodities.
Its proponents pointed to the US Treasury’s August 2026 decision to at least double its long-bond buybacks as an early sign of that shift.
The second thesis is physical.
It argues that the inventories cushioning the oil market will run out in late 2026 and 2027, that the Strait of Hormuz will remain choked into mid-2027, that diesel shortages matter more than crude, and that crude will reach inflation-adjusted highs by 2028.
Its core idea is that the flow is not the constraint; the cushion is. When buffers are gone, it argues, even modest losses of supply could send prices up 300% or 400%, as happened in 1973–74.
The thesis expects the supply shocks to spread to grains, fertiliser, coal, uranium, copper, gold and silver.
What the Evidence Supports
Strip away the rhetoric and the physical half of the bull case stands up surprisingly well.
The world entered 2026 with plenty of oil, but months of war, emergency stock releases and rerouted shipping drained the shock absorbers that normally stop a supply scare from becoming a price spike.
This is important because commodity prices do not respond to shortages in a straight line. When inventories are plentiful, a lost cargo barely registers. When they are thin, prices have to rise far enough to destroy demand before the market balances, as we saw in 1973 and 1979. This principle applies in every cycle, not just this one.
The Oil Buffers Are Thin
The US Strategic Petroleum Reserve fell from 415.4 million barrels in March 2026 to 283.0 million barrels in October, 39.6% of its capacity and the lowest level since 1982.
For perspective, the reserve held 726.6 million barrels at its December 2009 peak, so by October 2026, Washington’s emergency cushion was less than 40% of the size it was then.
Globally, observed oil inventories were 509 million barrels below their end-February level by September 2026, according to the International Energy Agency (IEA).
That shortfall is equivalent to five days of global oil consumption, removed from the system in about seven months.
Then there was the unusually fragile state of the global diesel market. US distillate inventories were 14% below their five-year average in August 2026, even with refineries running at 97.4% of capacity. The US Energy Information Administration expects them to stay below their five-year low through most of 2027, after Russia banned diesel exports in July 2026 and US retail diesel topped US$6 a gallon for the first time.
Diesel is the fuel that moves freight, powers mines and runs farm machinery, so a diesel squeeze feeds into the cost of almost everything else. It is also the fuel to which Australia is most exposed, a structural vulnerability that persists regardless of the cycle.
Australia’s Fuel Cushion Is Thinner Still
Australia imports the overwhelming majority of its refined fuel.
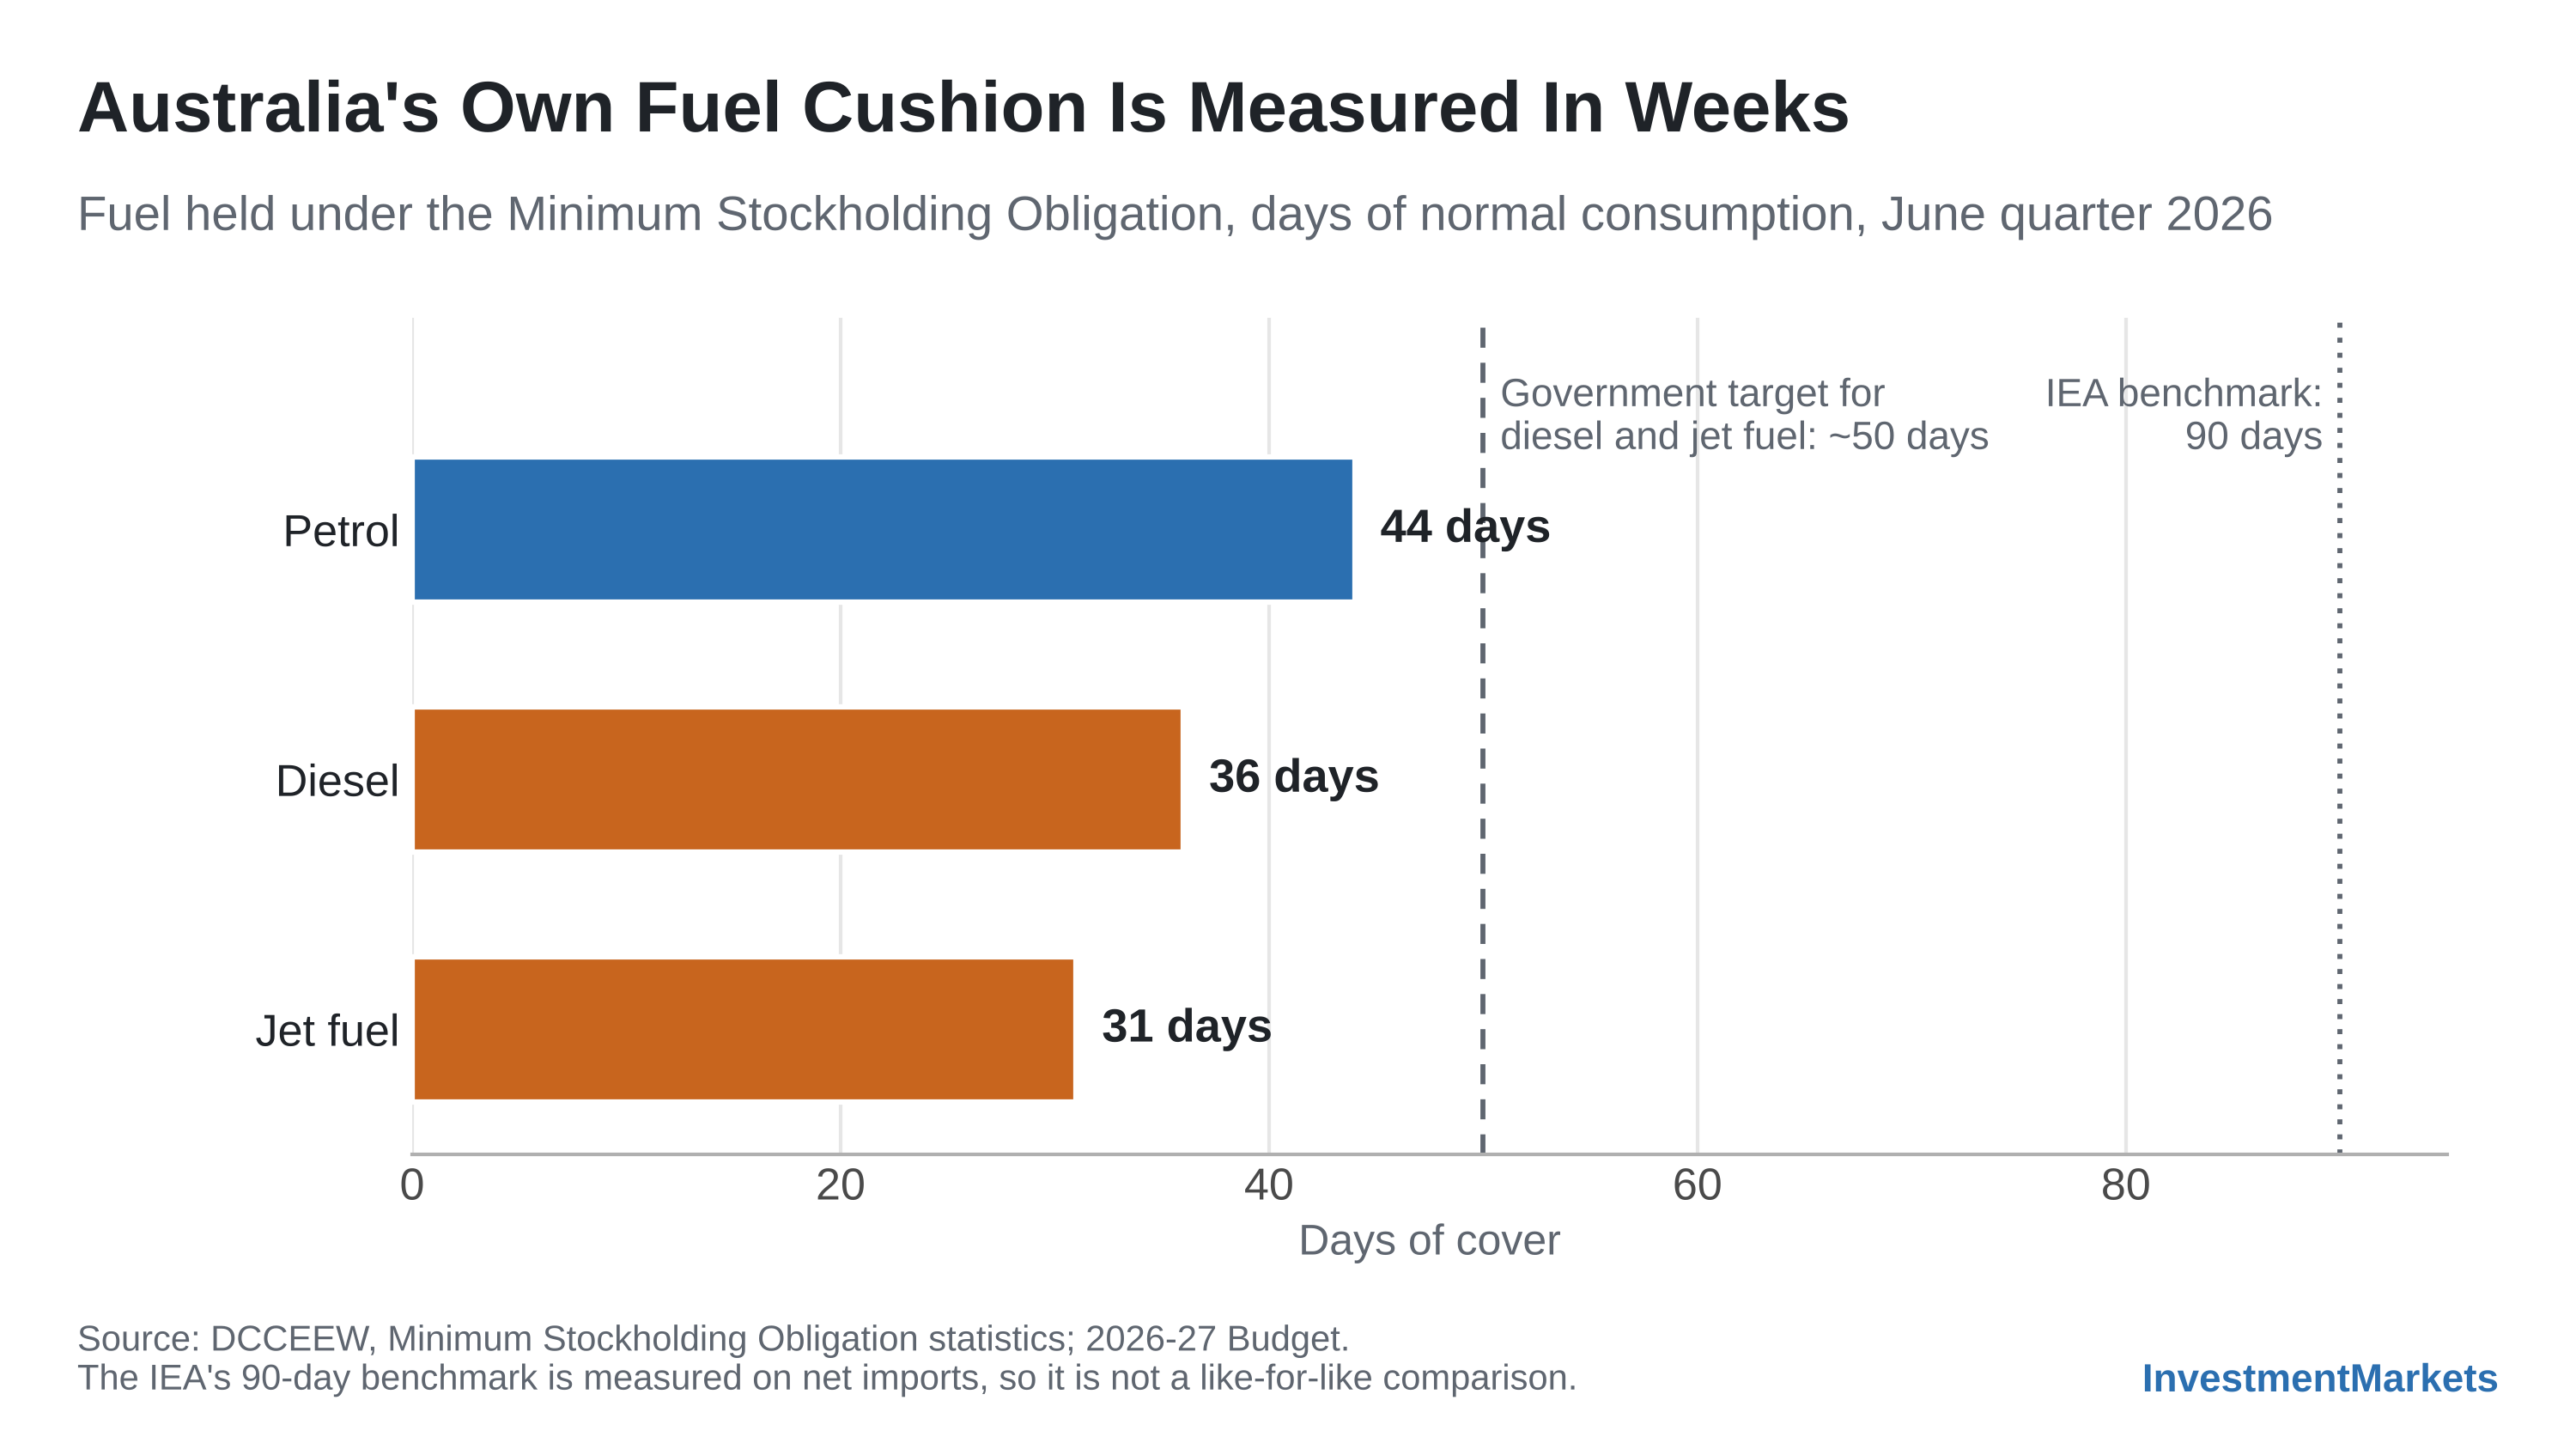
In the June quarter of 2026, industry held the equivalent of 36 days of diesel, 31 days of jet fuel and 44 days of petrol under the Minimum Stockholding Obligation.
Canberra’s response, a A$3.2 billion Australian Fuel Security Reserve plus an extra 10 days of mandatory stockholding, aims to lift diesel and jet fuel cover to about 50 days, the 2026-27 Budget shows. That’s well short of the IEA’s 90-day benchmark, although the two are measured differently.
A prolonged disruption would reach Australian households and businesses at the bowser long before it shows up in investors’ portfolio statements.
The Strait of Hormuz is the world’s most important oil chokepoint. Before the war, about a quarter of the world’s seaborne oil trade passed through it, which is why any disruption there has an outsized effect on global supply and prices.
In October 2026, IMF PortWatch recorded traffic running at a small fraction of the pre-crisis norm of 85 transits a day, with just four transits on 18 October.
Kpler data suggested that at least 10.1 million barrels a day were still crossing, supporting the bulls’ view that flows were larger than satellite data showed and that buffers, rather than flows, were the binding constraint.
Forecasters are hedging their views accordingly. The World Bank’s October 2026 baseline assumes Brent eases to an average of US$79 a barrel in 2027, but its adverse scenario, in which disruptions persist, puts the 2027 average at US$105.
The Long-Term Record: A Strong Year, a Weak Decade
The 2026 rally has been real, but the asset class’s long-term track record is sobering. In the 10 years to 30 September 2026, commodities returned just 1% p.a. against 11.2% p.a. for the S&P 500.
Hence, anyone claiming the commodities bull market began in 2020 is right about the direction of travel, but the payoff has been anaemic.
The experience within the asset class has also been wildly uneven.
World Bank data show its precious metals index rose more than 80% between 2021 and 2025 and climbed further in 2026, while its energy index finished 2025 6% below its 2021 average before the war sent it sharply higher.
The lesson is that timing the cycle matters enormously.
Commodities can generate extraordinary returns during super-cycles, but they also tend to suffer prolonged downturns, which seriously dilute the average returns on offer.
For Australian investors, there is a second lesson: the commodities that matter most to the ASX have not always been the ones leading the charge.
Where the Bull Case Overreaches
A strong physical story is not the same thing as a decade-long super-cycle. Before buying into the bigger claim, it’s worth testing its weak points:
Buybacks Are Not QE
The great commodity bull markets of the 1970s and 2000s were fuelled by falling or negative real interest rates and a weakening US dollar, which made non-yielding hard assets more attractive to hold.
As of late 2026, those conditions were not in place, at least in the all-important US Treasury market.
In August 2026, the US Treasury announced it would at least double its buybacks of long-dated bonds, funded by issuing short-term bills. In effect, the Treasury is swapping long debt for short debt rather than creating money. Even doubled, this US$4 billion operation is tiny against US$31.4 trillion of marketable debt.
For comparison, the Federal Reserve’s pandemic-era QE programme bought US$80 billion of Treasuries and US$40 billion of mortgage-backed securities every month.
Buybacks are not QE, and they are certainly not evidence that US Treasury yields have peaked.
With the Fed tightening rather than easing in 2026, including a rate rise in September, the macro backdrop that has historically supported a commodities super-cycle was not in place.
China Has Its Own Cushion
China plays a major role in global commodity markets, given its appetite for everything from crude oil to copper and iron ore. Its willingness to build and draw down strategic stockpiles also makes it a powerful shock absorber.
Oil is a good example. China imported a record 11.6 million barrels a day of oil in 2025, building its strategic stocks while prices were low, then cut imports to 8.1 million barrels a day in the second quarter of 2026.
In October 2026, analysts estimated that China’s onshore crude stockpile still held at least 1.2 billion barrels. Even after drawing on it in four of the five months to September, China’s imports and domestic output exceeded refinery runs over the first nine months of 2026.
In short, China has shown it can lean on stockpiles rather than chase prices, which is likely to cap how far an oil rally can run. That argues against a runaway commodities bull market for as long as those stockpiles remain large.
Hard Assets Are Not One Trade
The commodities world is a diverse one, with many markets driven by their own supply, demand and policy forces.
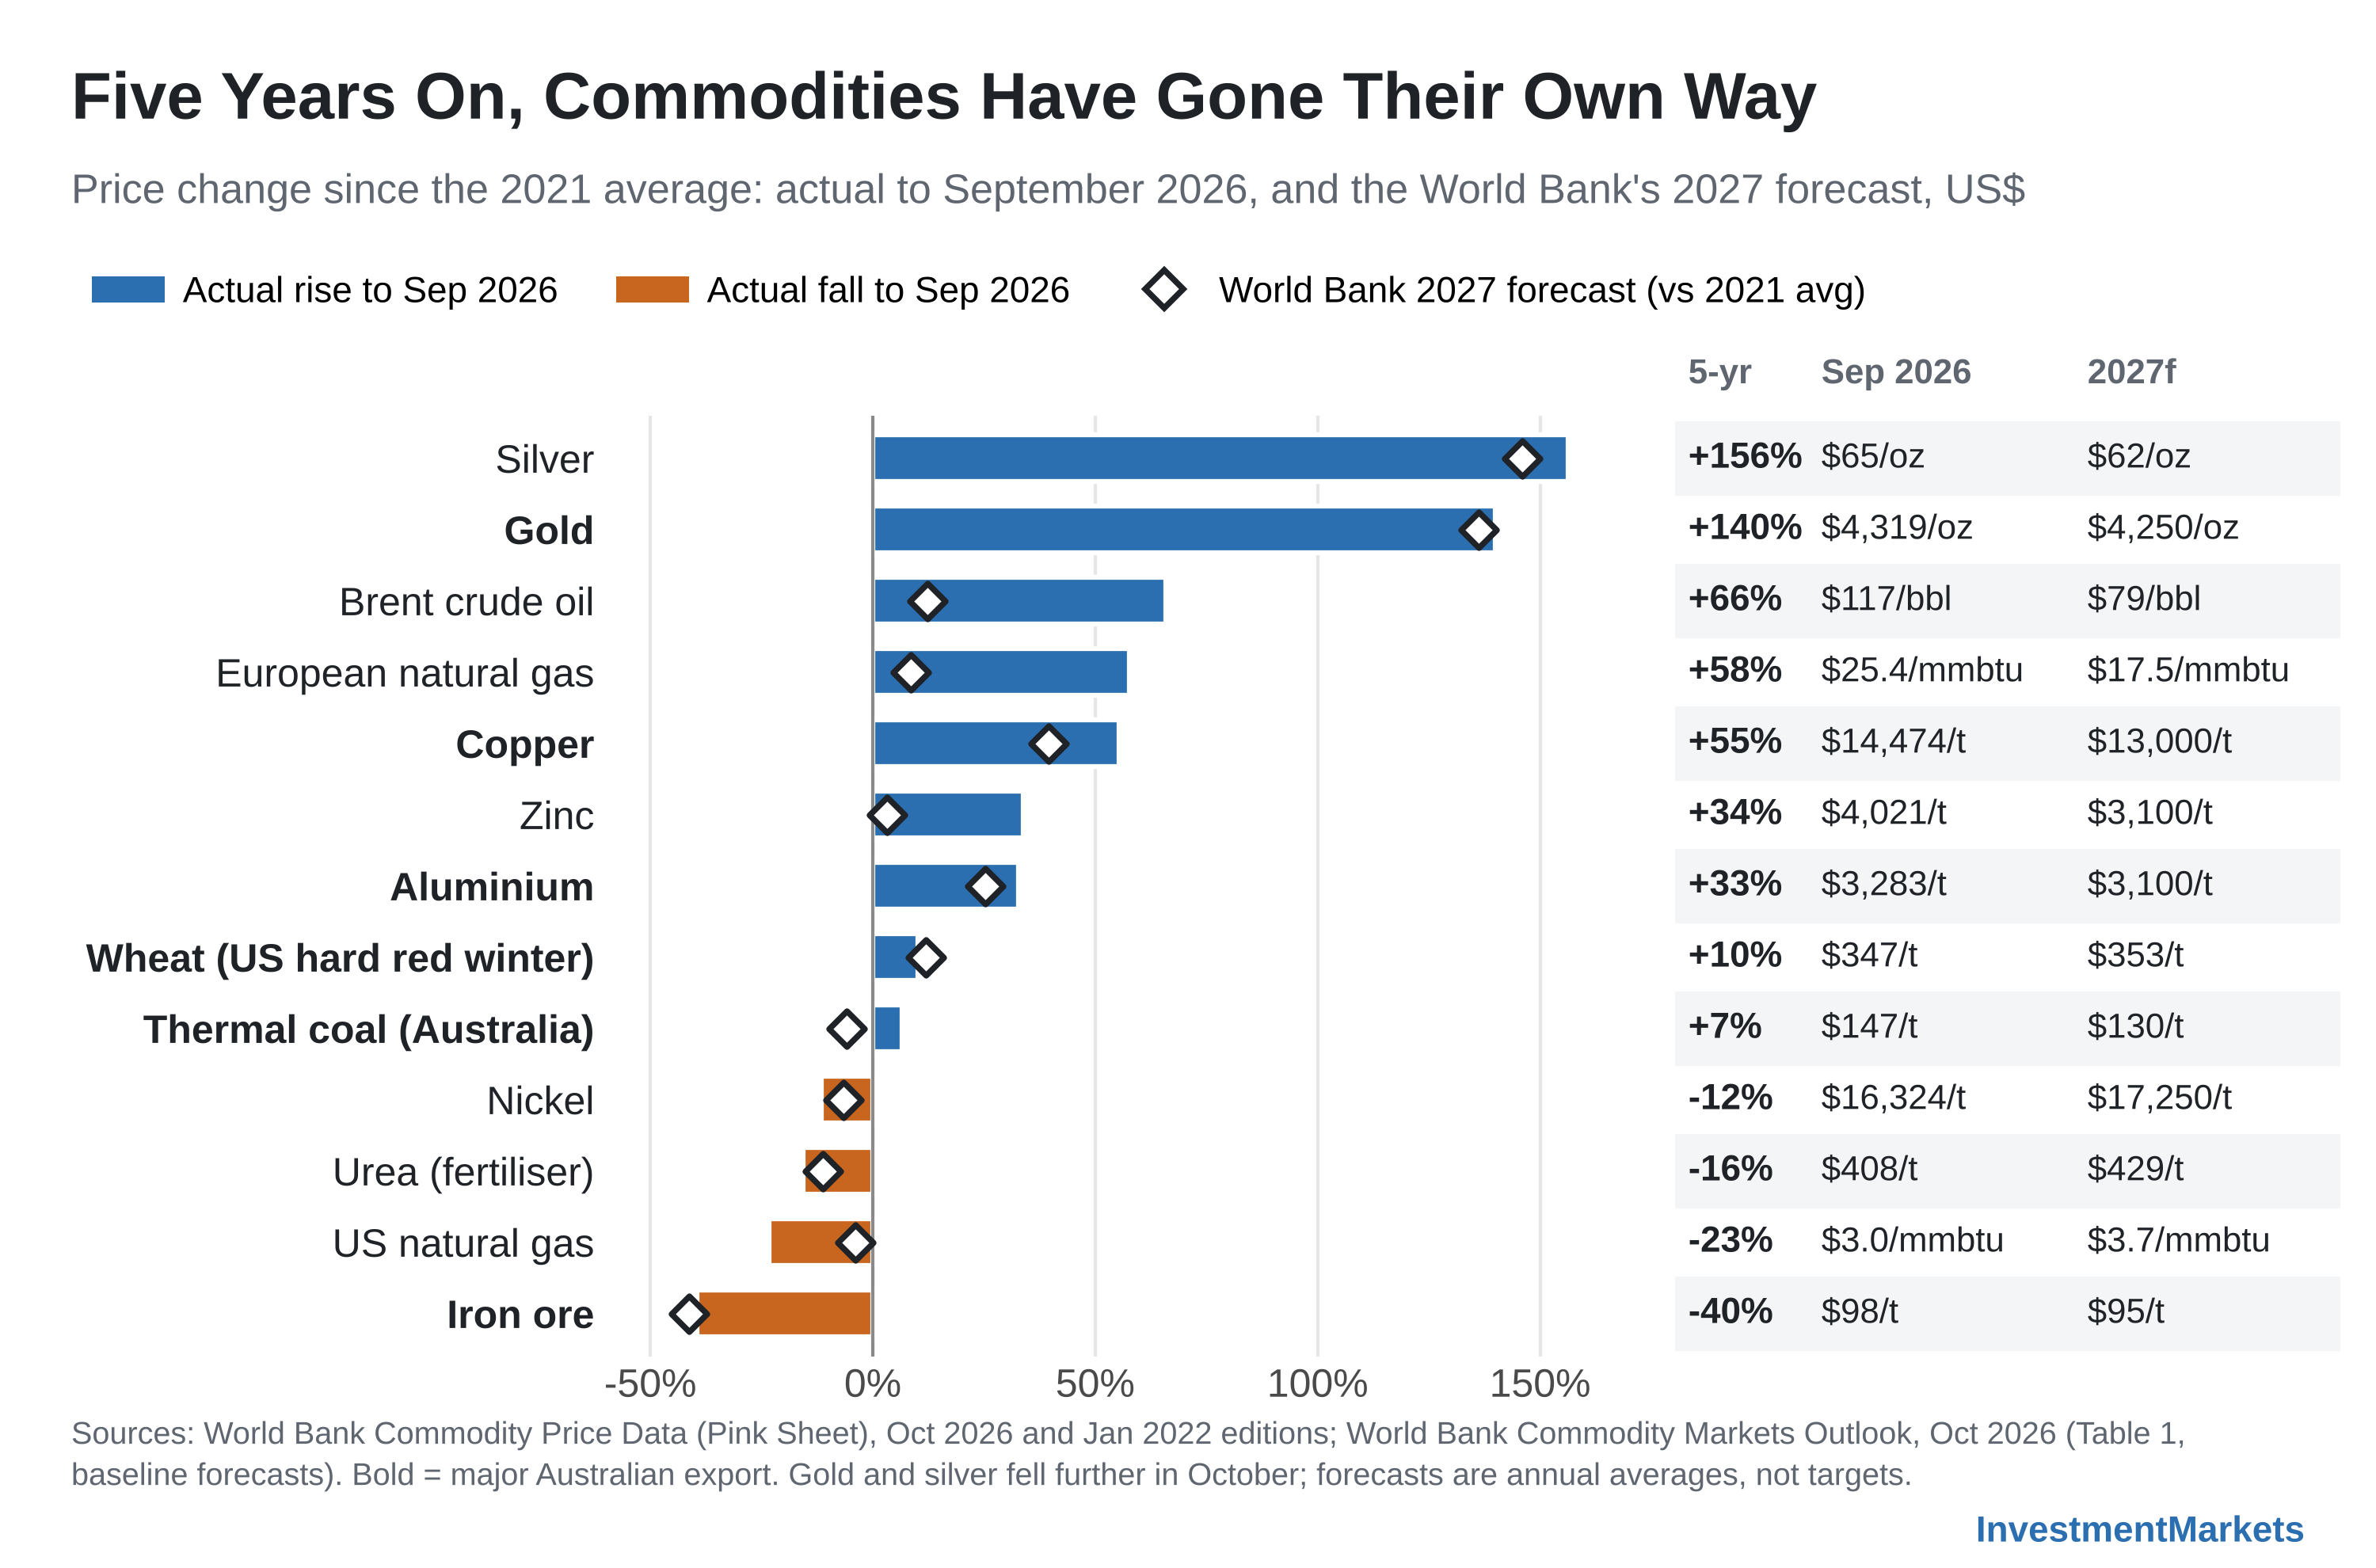
In 2026, copper hit record highs in September, while urea prices doubled after Hormuz closed before plummeting.
Grain prices rose only a few per cent in the weeks after the closure, compared with more than 70% for wheat after Russia invaded Ukraine in 2022. Grains firmed later, but largely for other reasons: drought across the Northern Hemisphere and renewed Black Sea tensions did more to lift wheat than Hormuz.
Stretch the lens to five years and the dispersion is even starker.
Measured against 2021 average prices, silver and gold had more than doubled by September 2026 and copper was up more than half, while iron ore had fallen about 40%.
The World Bank’s October 2026 forecasts suggest that ranking is unlikely to reverse in 2027.
Currency adds another layer for Australian investors. Because the Australian dollar tends to rise alongside commodity prices, unhedged investors often capture less of a rally than the US-dollar headline suggests. Hence, currency-hedged and unhedged versions of similar funds can deliver very different returns.
The Modern Economy Is Less Oil-Hungry
The 1973–74 Arab oil embargo nearly quadrupled oil prices, and the 1979 Iranian revolution more than doubled them.
Research suggests oil shocks now do less damage because oil is a smaller share of the economy and central banks act faster.
The world also needs far less oil to grow. Global oil intensity peaked in 1973, and by 2019 the world used 0.43 barrels of oil to produce US$1,000 of GDP, 56% less than at that peak.
Oil’s share of the global energy mix has fallen from about half in 1973 to less than a third in the 2020s, the IMF notes.
A painful oil shock could still happen, but a 1970s-style decade of runaway commodity inflation would need a far bigger and longer disruption than the one markets were pricing in late 2026.
Signposts to Watch: Is a Commodity Super-Cycle Forming?
The conditions that have historically turned a commodity shock into a super-cycle are worth being aware of.
Investors can test any future rally against five signposts:
Real interest rates: are real US Treasury yields falling or turning negative? The super-cycles of the 1970s and 2000s coincided with low or negative real rates.
The US dollar: is the US dollar weakening over a sustained period? A weaker dollar makes commodities cheaper for the rest of the world and has supported past bull markets.
Central bank policy: has the Federal Reserve shifted from rate rises to rate cuts or QE? Treasury debt management, such as bond buybacks, is not the same thing.
Inventories: are oil and diesel stocks staying below their five-year range? Thin buffers turn modest supply losses into large price moves.
China’s behaviour: is China drawing down its stockpiles to absorb shocks, or rebuilding them and competing for supply? The former caps rallies; the latter amplifies them.
If most of these signposts point the same way, the super-cycle case strengthens.
If only the inventory signpost is flashing, as it is at present, a sharp but temporary shock is the more likely outcome.
Investment Implications
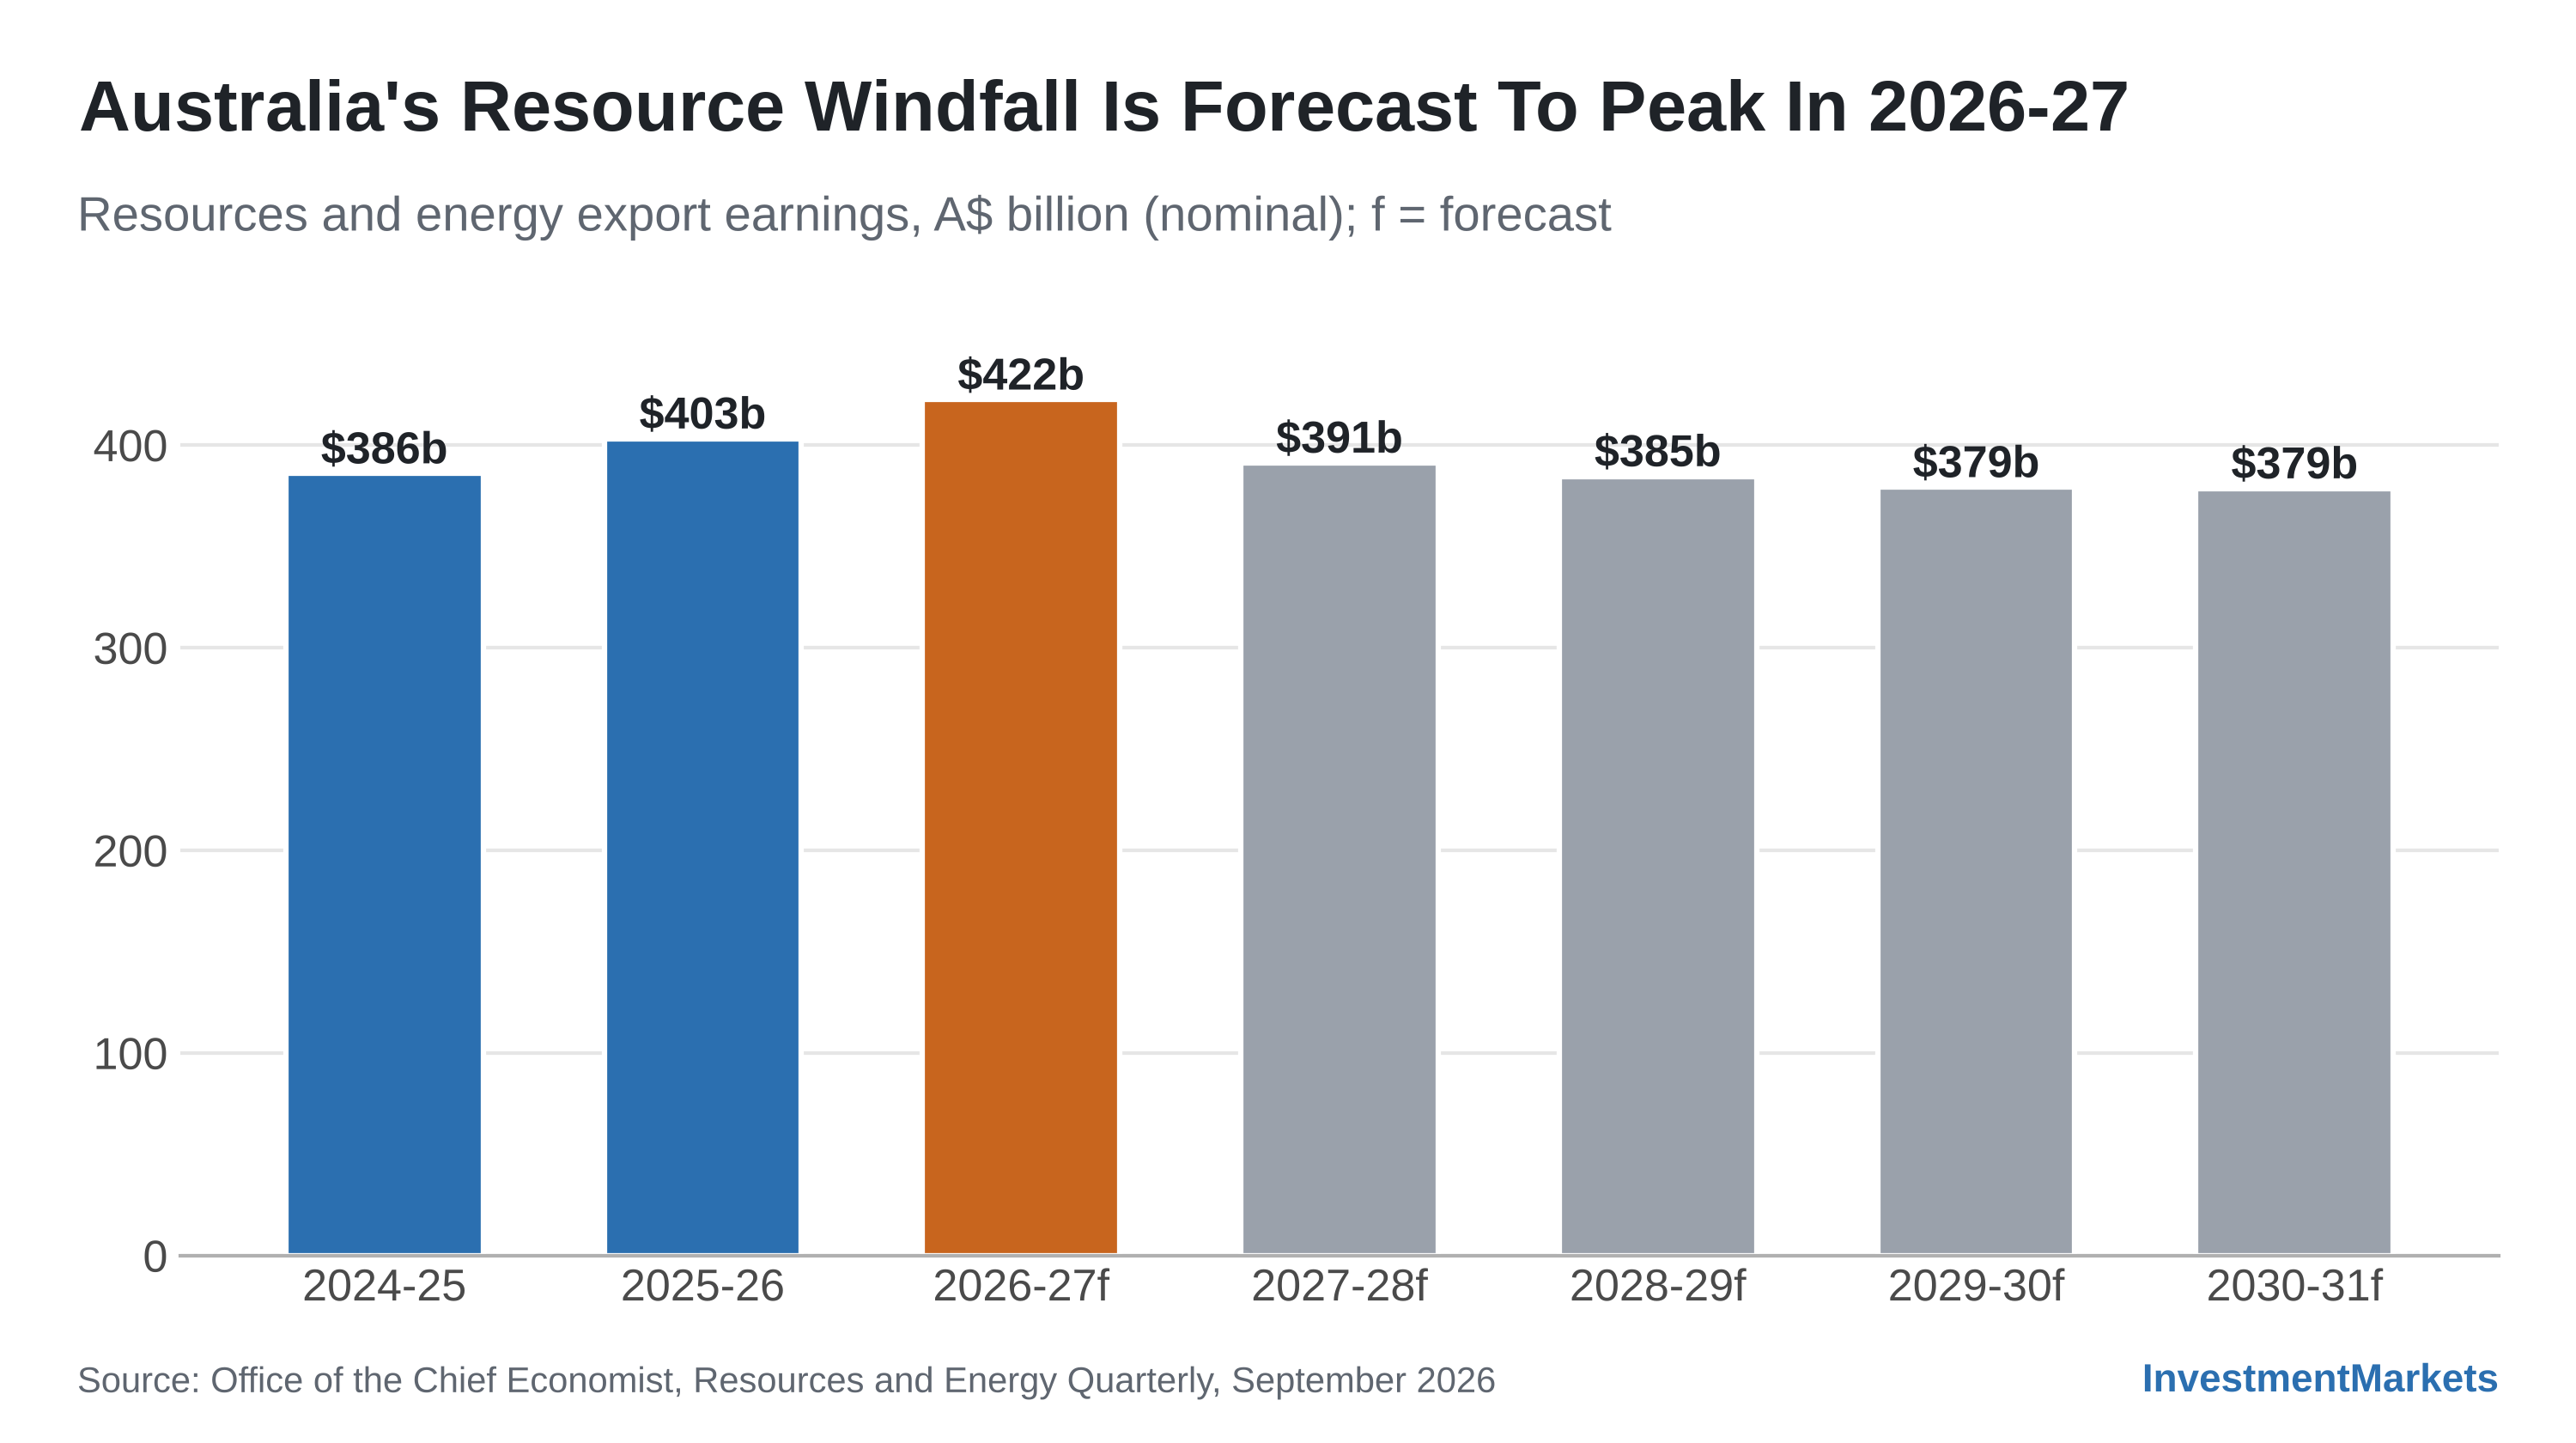
Australian investors generally hold a natural long position in commodities. Resources and energy exports are forecast to peak at A$422 billion in 2026-27, so an ASX-heavy portfolio already benefits from higher prices.
Ready to add more exposure? Each type of commodity fund behaves differently.
Broad futures funds, such as the Global X Bloomberg Commodity Complex ETF (BCOM), benefit from positive roll yield when futures curves are in backwardation, but suffer when curves move into contango.
Oil futures funds, such as the Betashares Crude Oil ETF (OOO), are tactical tools that can provide exposure to oil price spikes, but are generally less suited to long-term holding.
The bulls were right that the world ran down its oil buffers in 2026, while that a renewed shock in a market with no cushion would push prices sharply higher.
The super-cycle thesis is weaker on monetary policy, on China and on the idea that every hard asset will rise together.
For most Australian investors, the evidence supports a deliberate commodities allocation structured as a modest satellite, built on a clear view of whether the goal is inflation protection, diversification or a tactical view on oil. Review that allocation as the signposts above change, rather than in reaction to headlines.
What Is the Difference Between a Commodity Shock and a Super-Cycle?
A commodity shock is a sharp price spike caused by a sudden loss of supply, such as a war or embargo, and it often fades once supply recovers or demand falls. A super-cycle is a prolonged period, typically a decade or more, of elevated prices across many commodities. Historically, super-cycles have also needed falling real interest rates, a weaker US dollar and sustained demand growth.
What Causes Oil Price Shocks?
Oil price shocks occur when supply is disrupted while inventories are too thin to absorb the loss, forcing prices high enough to destroy demand. Examples include the 1973–74 Arab oil embargo, the 1979 Iranian revolution, the 1990 Gulf War and, in 2026, the war involving Iran, which severely restricted tanker traffic through the Strait of Hormuz while strategic and commercial inventories were drawn down sharply.
Are Treasury Buybacks the Same as Quantitative Easing?
No. Treasury buybacks repurchase older long-dated bonds using money raised from new short-term debt. They improve market functioning but do not create new money in the way Federal Reserve QE does.
Are Commodity ETFs a Good Inflation Hedge?
Broad commodities have historically performed well during supply-driven inflation, but returns depend heavily on ETF structure, futures roll yield and timing. In the decade to September 2026, they lagged shares by a wide margin.
How Much Commodity Exposure Should a Portfolio Have?
There is no single answer. Many diversified investors treat commodities as a satellite allocation of roughly 5% to 15%, but Australians with large ASX resources holdings may already have substantial indirect exposure.
How Do Commodity Prices Affect Australian Investors?
Australia earns around A$400 billion a year from resources and energy exports, so higher commodity prices generally lift ASX miners, energy producers, company tax receipts and the Australian dollar. However, Australia imports most of its refined fuel, so oil shocks also raise household and business costs.
What Do Forecasters Expect for Commodity Prices?
Forecasts are updated regularly, so it pays to check the latest edition. In its October 2026 Commodity Markets Outlook, the World Bank expected overall commodity prices to fall about 7% in 2027 after rising 23% in 2026. Its baseline had Brent averaging US$79 a barrel, gold US$4,250 an ounce, copper US$13,000 a tonne and iron ore US$95 a tonne in 2027.
The Global X Bloomberg Commodity Complex ETF (BCOM) invests in a highly liquid, broad-based basket of commodities, including energy, grains, precious metals, industrial metals, softs and livestock.
OOO aims to track the performance of an index (before fees and expenses) that provides exposure to crude oil futures, hedged for currency movements in the AUD/USD exchange rate.
FUEL aims to track the performance of an index (before fees and expenses) that comprises the largest global energy companies (ex-Australia), hedged into Australian dollars.
Disclaimer: This article is prepared by Simon Turner. It is for educational purposes only. While all reasonable care has been taken by the author in the preparation of this information, the author and InvestmentMarkets (Aust) Pty. Ltd. as publisher take no responsibility for any actions taken based on information contained herein or for any errors or omissions within it. Interested parties should seek independent professional advice prior to acting on any information presented. Please note past performance is not a reliable indicator of future performance.
Simon Turner is an ex-fund manager with 20 years investing experience gained at Bluecrest, Kempen and Singer & Friedlander who now writes educational content about investing and sustainability. He's also the published author of The Connection Game and Secrets of a River Swimmer.
As contrarian investors, we often find ourselves in unloved areas of the market. Eighteen months ago, lithium miners fell squarely into the ‘unloved’ category. In fact, it would have been difficult to find a more out-of-favour area of the market at the time.
Super has traditionally been a tax-effective investment vehicle, but with a raft of regulatory changes over the past year, investors may be wondering which structure is the right call for their investments.
We all know that markets move in bull and bear phases while the long-term trend is up.
Of course, every bull market phase ends, at least until the market is cleansed of excess.
Are you an investor or a gambler? In truth, you may be both.
Australians lost $36 billion on gambling in the year to March 2026, $1,290 for every person in the country. Most of those punters knew the odds were against them. They bet anyway. What they bought was hope rather than a prudent prospect of generating a return.





-l41u2ptkx9onbqj7pipi.png)
-vmtf4wo29a20xxj6oknl.png)
-u0rwzyy49swonlqpcs4a.png)
-ti3096hxzl3gm9am9ig9.png)
-8uexkx4bnscs7ze3rtpw.png)
-0xx59tid6lwcl8n1yune.png)